|
Download Data (XLS File) |
|
||||||||
|
||||||||
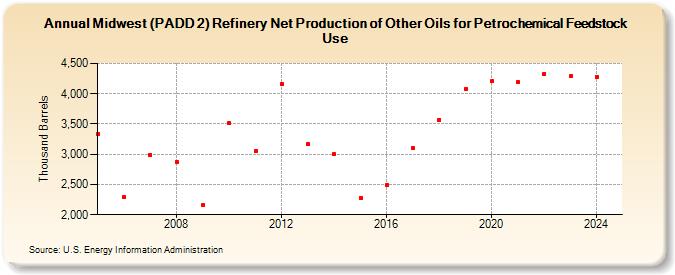
| Midwest (PADD 2) Refinery Net Production of Other Oils for Petrochemical Feedstock Use (Thousand Barrels) | ||||||||
| Decade | Year-0 | Year-1 | Year-2 | Year-3 | Year-4 | Year-5 | Year-6 | Year-7 | Year-8 | Year-9 |
|---|---|---|---|---|---|---|---|---|---|---|
| 2000's | 3,337 | 2,289 | 2,994 | 2,872 | 2,156 | |||||
| 2010's | 3,516 | 3,048 | 4,157 | 3,163 | 2,996 | 2,284 | 2,492 | 3,098 | 3,572 | 4,082 |
| 2020's | 4,208 | 4,187 | 4,333 | 4,286 |
| - = No Data Reported; -- = Not Applicable; NA = Not Available; W = Withheld to avoid disclosure of individual company data. |
| Release Date: 3/29/2024 |
| Next Release Date: 8/30/2024 |