|
Download Data (XLS File) |
|
||||||||
|
||||||||
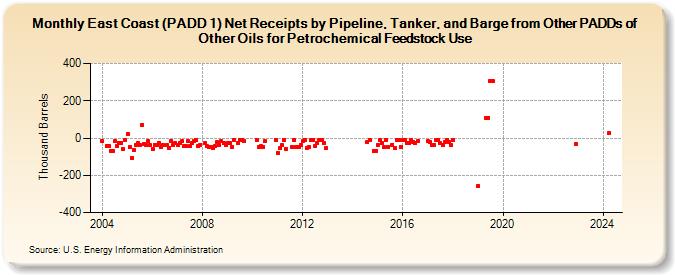
| East Coast (PADD 1) Net Receipts by Pipeline, Tanker, and Barge from Other PADDs of Other Oils for Petrochemical Feedstock Use (Thousand Barrels) | ||||||||
| Year | Jan | Feb | Mar | Apr | May | Jun | Jul | Aug | Sep | Oct | Nov | Dec |
|---|---|---|---|---|---|---|---|---|---|---|---|---|
| 2004 | -17 | -41 | -41 | -68 | -71 | -17 | -44 | -26 | -25 | -60 | -13 | |
| 2005 | 22 | -47 | -107 | -62 | -35 | -26 | -35 | 70 | -30 | -35 | -17 | -40 |
| 2006 | -61 | -36 | -35 | -26 | -49 | -36 | -38 | -51 | -17 | -36 | -26 | |
| 2007 | -35 | -26 | -18 | -45 | -44 | -18 | -43 | -27 | -17 | -9 | -43 | -35 |
| 2008 | -29 | -45 | -48 | -48 | -53 | -43 | -24 | -36 | -18 | -27 | -36 | |
| 2009 | -27 | -27 | -47 | -8 | -26 | -8 | -9 | -17 | ||||
| 2010 | -8 | -46 | -43 | -47 | -18 | -8 | ||||||
| 2011 | -78 | -56 | -37 | -9 | -57 | -48 | -9 | -47 | -46 | -37 | ||
| 2012 | -18 | -8 | -53 | -48 | -10 | -9 | -45 | -27 | -9 | -9 | -28 | -55 |
| 2014 | -19 | -9 | -68 | -68 | ||||||||
| 2015 | -36 | -10 | -27 | -48 | -10 | -46 | -36 | -54 | -9 | -9 | -46 | |
| 2016 | -9 | -10 | -28 | -29 | -10 | -19 | -28 | -18 | ||||
| 2017 | -18 | -19 | -39 | -37 | -9 | -9 | -27 | -37 | -19 | -9 | -19 | -38 |
| 2018 | -9 | |||||||||||
| 2019 | -255 | 109 | 109 | 305 | 305 | |||||||
| 2022 | -31 | |||||||||||
| 2024 | 25 | |||||||||||
| - = No Data Reported; -- = Not Applicable; NA = Not Available; W = Withheld to avoid disclosure of individual company data. |
| Release Date: 6/28/2024 |
| Next Release Date: 7/31/2024 |