|
Download Data (XLS File) |
|
||||||||
|
||||||||
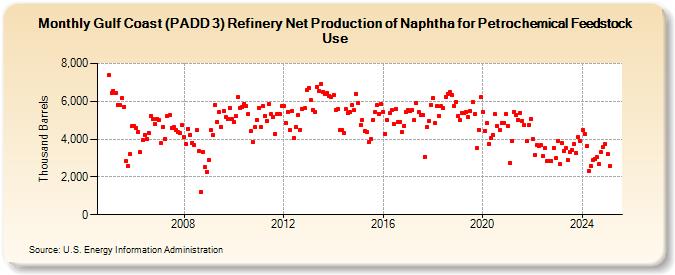
| Gulf Coast (PADD 3) Refinery Net Production of Naphtha for Petrochemical Feedstock Use (Thousand Barrels) | ||||||||
| Year | Jan | Feb | Mar | Apr | May | Jun | Jul | Aug | Sep | Oct | Nov | Dec |
|---|---|---|---|---|---|---|---|---|---|---|---|---|
| 2005 | 7,389 | 6,463 | 6,565 | 6,461 | 5,798 | 5,795 | 6,157 | 5,714 | 2,827 | 2,559 | 3,192 | 4,687 |
| 2006 | 4,687 | 4,568 | 4,366 | 3,296 | 3,958 | 4,238 | 3,996 | 4,347 | 5,243 | 5,053 | 4,807 | 5,087 |
| 2007 | 4,998 | 3,771 | 4,658 | 4,021 | 5,236 | 5,258 | 4,610 | 4,625 | 4,482 | 4,364 | 4,300 | 4,721 |
| 2008 | 4,093 | 3,717 | 4,542 | 4,239 | 3,809 | 3,676 | 4,467 | 3,352 | 1,219 | 3,311 | 2,504 | 2,283 |
| 2009 | 2,904 | 4,464 | 4,221 | 5,820 | 4,921 | 5,443 | 4,651 | 5,492 | 5,159 | 5,037 | 5,655 | 5,068 |
| 2010 | 4,912 | 5,198 | 6,210 | 5,633 | 5,697 | 5,874 | 5,745 | 5,330 | 4,407 | 3,831 | 4,623 | 5,024 |
| 2011 | 5,648 | 4,644 | 5,733 | 5,235 | 4,973 | 5,864 | 5,309 | 5,174 | 4,273 | 5,307 | 5,335 | 5,756 |
| 2012 | 5,736 | 4,868 | 5,455 | 4,457 | 5,499 | 4,083 | 4,615 | 5,252 | 4,495 | 5,613 | 5,624 | 6,578 |
| 2013 | 6,708 | 6,045 | 5,565 | 5,459 | 6,770 | 6,534 | 6,910 | 6,511 | 6,371 | 6,433 | 6,303 | 6,236 |
| 2014 | 6,310 | 5,548 | 5,569 | 4,477 | 4,497 | 4,340 | 5,592 | 5,372 | 5,434 | 5,795 | 5,518 | 6,406 |
| 2015 | 5,920 | 4,736 | 5,018 | 4,422 | 4,375 | 3,828 | 3,988 | 5,031 | 5,426 | 5,784 | 5,342 | 5,870 |
| 2016 | 5,435 | 4,288 | 4,995 | 5,362 | 5,520 | 4,817 | 5,608 | 4,901 | 4,930 | 4,380 | 4,714 | 5,432 |
| 2017 | 5,536 | 5,483 | 5,533 | 5,010 | 5,910 | 5,438 | 5,264 | 5,271 | 3,072 | 4,621 | 4,951 | 5,822 |
| 2018 | 6,172 | 4,840 | 5,731 | 5,240 | 5,733 | 5,640 | 6,217 | 6,408 | 6,475 | 6,335 | 5,756 | 5,971 |
| 2019 | 5,203 | 4,988 | 5,388 | 5,373 | 5,423 | 5,162 | 5,490 | 5,955 | 5,309 | 3,505 | 4,504 | 6,212 |
| 2020 | 5,411 | 4,449 | 4,851 | 3,748 | 4,063 | 4,216 | 5,313 | 4,675 | 4,467 | 4,841 | 4,860 | 5,322 |
| 2021 | 4,709 | 2,756 | 3,913 | 5,446 | 5,269 | 5,029 | 5,403 | 4,974 | 4,732 | 3,889 | 4,749 | 5,074 |
| 2022 | 4,017 | 3,184 | 3,675 | 3,636 | 3,700 | 3,105 | 3,512 | 2,827 | 2,837 | 2,842 | 3,546 | 2,986 |
| 2023 | 3,922 | 2,666 | 3,777 | 3,377 | 3,497 | 2,882 | 3,326 | 3,418 | 3,763 | 3,253 | 4,140 | 3,877 |
| 2024 | 4,459 | 4,292 | 3,611 | 2,319 | ||||||||
| - = No Data Reported; -- = Not Applicable; NA = Not Available; W = Withheld to avoid disclosure of individual company data. |
| Release Date: 6/28/2024 |
| Next Release Date: 7/31/2024 |