|
Download Data (XLS File) |
|
||||||||
|
||||||||
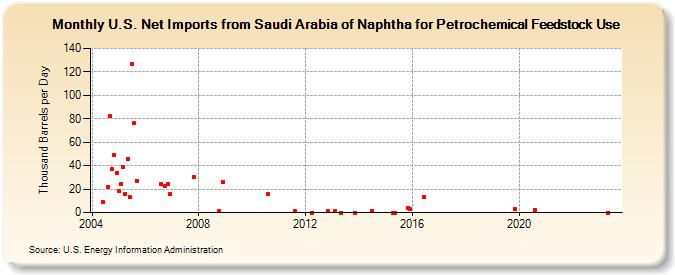
| U.S. Net Imports from Saudi Arabia of Naphtha for Petrochemical Feedstock Use (Thousand Barrels per Day) | ||||||||
| Year | Jan | Feb | Mar | Apr | May | Jun | Jul | Aug | Sep | Oct | Nov | Dec |
|---|---|---|---|---|---|---|---|---|---|---|---|---|
| 2004 | 9 | 22 | 82 | 37 | 49 | 34 | ||||||
| 2005 | 18 | 24 | 39 | 16 | 46 | 13 | 127 | 76 | 27 | |||
| 2006 | 24 | 23 | 24 | 16 | ||||||||
| 2007 | 30 | |||||||||||
| 2008 | 1 | 26 | ||||||||||
| 2010 | 16 | |||||||||||
| 2011 | 1 | |||||||||||
| 2012 | 0 | 1 | ||||||||||
| 2013 | 1 | 0 | 0 | |||||||||
| 2014 | 1 | |||||||||||
| 2015 | 0 | 0 | 4 | 3 | ||||||||
| 2016 | 13 | |||||||||||
| 2019 | 3 | |||||||||||
| 2020 | 2 | |||||||||||
| 2023 | 0 | |||||||||||
| - = No Data Reported; -- = Not Applicable; NA = Not Available; W = Withheld to avoid disclosure of individual company data. |
| Release Date: 8/30/2024 |
| Next Release Date: 9/30/2024 |