|
Download Data (XLS File) |
|
||||||||
|
||||||||
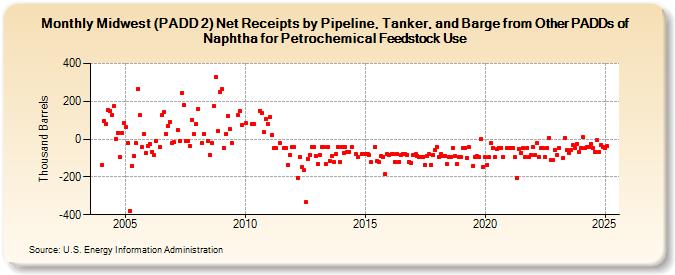
| Midwest (PADD 2) Net Receipts by Pipeline, Tanker, and Barge from Other PADDs of Naphtha for Petrochemical Feedstock Use (Thousand Barrels) | ||||||||
| Year | Jan | Feb | Mar | Apr | May | Jun | Jul | Aug | Sep | Oct | Nov | Dec |
|---|---|---|---|---|---|---|---|---|---|---|---|---|
| 2004 | -138 | 96 | 82 | 155 | 146 | 126 | 175 | 3 | 34 | -93 | 32 | 83 |
| 2005 | 62 | -18 | -379 | -140 | -90 | -23 | 265 | 126 | -44 | 26 | -73 | -34 |
| 2006 | -26 | -66 | -85 | -10 | -44 | 125 | 143 | 29 | 67 | 93 | -19 | |
| 2007 | -17 | 49 | -9 | 243 | 182 | -9 | -9 | -34 | 103 | 26 | 80 | |
| 2008 | 159 | -19 | 29 | -9 | -83 | -21 | 176 | 328 | 42 | 250 | ||
| 2009 | 264 | -46 | 25 | 124 | 53 | -20 | 126 | 148 | 72 | |||
| 2010 | 85 | 81 | 80 | 151 | 137 | 35 | 106 | 80 | ||||
| 2011 | 116 | 21 | -49 | -47 | -19 | -47 | -49 | -135 | -83 | -42 | ||
| 2012 | -42 | -204 | -97 | -147 | -165 | -335 | -103 | -83 | -41 | -42 | -89 | |
| 2013 | -132 | -83 | -42 | -42 | -130 | -41 | -115 | -90 | -120 | -81 | -40 | -122 |
| 2014 | -41 | -72 | -42 | -70 | -66 | -40 | -81 | -97 | -81 | -81 | ||
| 2015 | -81 | -81 | -85 | -122 | -40 | -118 | -122 | -91 | -93 | -187 | -80 | |
| 2016 | -82 | -80 | -80 | -121 | -81 | -120 | -82 | -79 | -79 | -82 | -121 | -124 |
| 2017 | -82 | -81 | -90 | -97 | -94 | -94 | -136 | -90 | -81 | -135 | -82 | -59 |
| 2018 | -43 | -94 | -81 | -90 | -89 | -134 | -93 | -94 | -45 | -90 | -133 | -95 |
| 2019 | -97 | -45 | -46 | -98 | -43 | -140 | -94 | -91 | -97 | -1 | -146 | |
| 2020 | -97 | -137 | -96 | -23 | -45 | -97 | -51 | -45 | -45 | -95 | -49 | |
| 2021 | -46 | -49 | -49 | -97 | -204 | -51 | -72 | -49 | -93 | -45 | -97 | -83 |
| 2022 | -42 | -84 | -22 | -97 | -48 | -49 | -94 | -48 | 6 | -113 | -109 | -57 |
| 2023 | -85 | -47 | -98 | 8 | -56 | -71 | -57 | -33 | -45 | -24 | -67 | |
| 2024 | -46 | |||||||||||
| - = No Data Reported; -- = Not Applicable; NA = Not Available; W = Withheld to avoid disclosure of individual company data. |
| Release Date: 3/29/2024 |
| Next Release Date: 4/30/2024 |