|
Download Data (XLS File) |
|
||||||||
|
||||||||
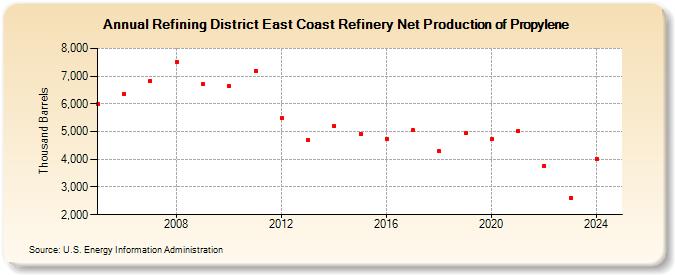
| Refining District East Coast Refinery Net Production of Propylene (Thousand Barrels) | ||||||||
| Decade | Year-0 | Year-1 | Year-2 | Year-3 | Year-4 | Year-5 | Year-6 | Year-7 | Year-8 | Year-9 |
|---|---|---|---|---|---|---|---|---|---|---|
| 2000's | 6,005 | 6,368 | 6,827 | 7,512 | 6,701 | |||||
| 2010's | 6,626 | 7,200 | 5,498 | 4,695 | 5,206 | 4,915 | 4,743 | 5,043 | 4,287 | 4,930 |
| 2020's | 4,716 | 5,011 | 3,764 | 2,615 |
| - = No Data Reported; -- = Not Applicable; NA = Not Available; W = Withheld to avoid disclosure of individual company data. |
| Release Date: 6/28/2024 |
| Next Release Date: 8/30/2024 |
Referring Pages: