|
Download Data (XLS File) |
|
||||||||
|
||||||||
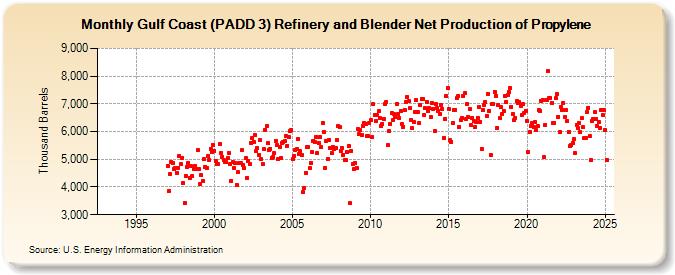
| Gulf Coast (PADD 3) Refinery and Blender Net Production of Propylene (Thousand Barrels) | ||||||||
| Year | Jan | Feb | Mar | Apr | May | Jun | Jul | Aug | Sep | Oct | Nov | Dec |
|---|---|---|---|---|---|---|---|---|---|---|---|---|
| 1993 | W | W | W | W | W | W | W | W | W | W | W | W |
| 1994 | W | W | W | W | W | W | W | W | W | W | W | W |
| 1995 | W | W | W | W | W | W | W | W | W | W | W | W |
| 1996 | W | W | W | W | W | W | W | W | W | W | W | W |
| 1997 | 4,769 | 3,852 | 4,483 | 4,904 | 4,878 | 4,638 | 4,681 | 4,522 | 4,683 | 5,118 | 4,817 | 5,055 |
| 1998 | 4,147 | 3,417 | 4,413 | 4,733 | 4,872 | 4,340 | 4,760 | 4,392 | 4,641 | 4,758 | 4,665 | 5,319 |
| 1999 | 4,635 | 4,116 | 4,428 | 4,214 | 5,009 | 4,734 | 4,690 | 5,116 | 4,990 | 5,381 | 5,264 | 5,515 |
| 2000 | 5,311 | 4,946 | 4,846 | 4,828 | 5,550 | 5,237 | 5,093 | 4,990 | 4,909 | 4,908 | 5,033 | 5,228 |
| 2001 | 4,827 | 4,221 | 4,886 | 4,702 | 4,853 | 4,080 | 4,531 | 4,863 | 4,851 | 5,324 | 4,808 | 4,690 |
| 2002 | 5,036 | 4,329 | 4,942 | 4,831 | 5,603 | 5,765 | 5,634 | 5,867 | 5,315 | 5,397 | 5,170 | 5,690 |
| 2003 | 4,995 | 4,817 | 5,358 | 6,060 | 6,188 | 5,575 | 5,349 | 5,384 | 5,053 | 5,085 | 5,209 | 5,664 |
| 2004 | 5,510 | 4,993 | 5,442 | 5,055 | 5,595 | 5,639 | 5,659 | 5,842 | 5,496 | 5,813 | 6,019 | 6,065 |
| 2005 | 4,993 | 5,128 | 5,338 | 5,375 | 5,733 | 5,202 | 5,284 | 5,138 | 3,807 | 3,953 | 4,519 | 5,443 |
| 2006 | 5,431 | 4,685 | 4,882 | 5,255 | 5,672 | 5,618 | 5,816 | 5,218 | 5,580 | 5,816 | 5,426 | 6,318 |
| 2007 | 5,990 | 4,698 | 5,663 | 5,017 | 5,708 | 5,413 | 5,224 | 5,446 | 5,359 | 5,395 | 5,713 | 6,211 |
| 2008 | 6,147 | 5,312 | 5,406 | 5,152 | 4,978 | 4,964 | 5,263 | 5,469 | 3,405 | 5,309 | 4,827 | 4,638 |
| 2009 | 4,868 | 4,703 | 6,081 | 5,902 | 6,039 | 5,883 | 6,217 | 6,316 | 6,279 | 5,836 | 5,823 | 6,324 |
| 2010 | 6,401 | 5,805 | 6,983 | 6,607 | 6,388 | 6,583 | 6,731 | 6,471 | 6,188 | 6,285 | 6,462 | 6,986 |
| 2011 | 7,064 | 5,504 | 6,002 | 6,280 | 6,662 | 6,425 | 6,629 | 6,511 | 6,997 | 6,620 | 6,482 | 6,743 |
| 2012 | 6,278 | 6,179 | 6,787 | 7,072 | 7,255 | 7,092 | 6,838 | 6,429 | 6,115 | 6,356 | 6,722 | 7,133 |
| 2013 | 6,704 | 6,325 | 6,964 | 7,175 | 7,161 | 6,604 | 6,833 | 7,051 | 6,742 | 6,846 | 6,527 | 7,038 |
| 2014 | 6,814 | 6,030 | 6,978 | 6,832 | 6,745 | 6,629 | 6,955 | 6,819 | 5,783 | 6,458 | 7,289 | 7,572 |
| 2015 | 6,798 | 5,679 | 5,626 | 6,318 | 6,789 | 6,787 | 7,199 | 7,291 | 6,178 | 6,405 | 6,495 | 7,267 |
| 2016 | 7,379 | 6,439 | 6,994 | 6,525 | 6,805 | 6,245 | 6,503 | 6,385 | 6,164 | 6,337 | 6,499 | 6,896 |
| 2017 | 6,358 | 5,373 | 6,788 | 6,968 | 7,066 | 6,574 | 7,363 | 6,746 | 5,158 | 6,983 | 6,992 | 7,438 |
| 2018 | 7,297 | 6,142 | 6,960 | 6,473 | 6,903 | 6,622 | 6,743 | 7,274 | 7,067 | 7,303 | 7,423 | 7,576 |
| 2019 | 6,897 | 6,638 | 6,408 | 6,498 | 7,090 | 7,020 | 7,069 | 6,922 | 6,608 | 6,984 | 6,686 | 6,737 |
| 2020 | 6,397 | 5,253 | 5,980 | 6,187 | 6,302 | 6,156 | 6,328 | 6,045 | 6,184 | 6,791 | 6,758 | 7,098 |
| 2021 | 7,139 | 5,075 | 6,252 | 7,131 | 8,172 | 7,219 | 7,214 | 7,046 | 6,304 | 6,312 | 7,195 | 7,344 |
| 2022 | 6,543 | 5,969 | 6,902 | 6,787 | 7,038 | 6,543 | 6,773 | 6,383 | 6,000 | 5,462 | 5,518 | 5,600 |
| 2023 | 5,714 | 5,221 | 6,247 | 6,146 | 6,305 | 5,968 | 6,472 | 6,160 | 5,771 | 5,680 | 6,692 | 6,852 |
| 2024 | 5,836 | |||||||||||
| - = No Data Reported; -- = Not Applicable; NA = Not Available; W = Withheld to avoid disclosure of individual company data. |
| Release Date: 3/29/2024 |
| Next Release Date: 4/30/2024 |