|
Download Data (XLS File) |
|
||||||||
|
||||||||
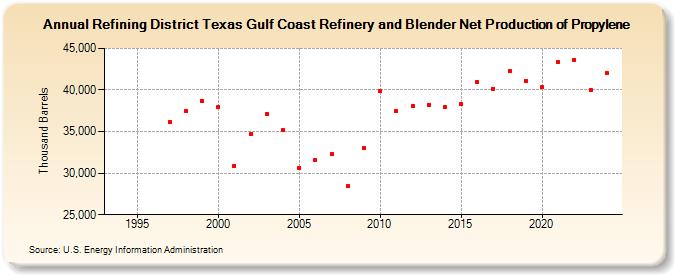
| Refining District Texas Gulf Coast Refinery and Blender Net Production of Propylene (Thousand Barrels) | ||||||||
| Decade | Year-0 | Year-1 | Year-2 | Year-3 | Year-4 | Year-5 | Year-6 | Year-7 | Year-8 | Year-9 |
|---|---|---|---|---|---|---|---|---|---|---|
| 1990's | W | W | W | W | 36,203 | 37,501 | 38,711 | |||
| 2000's | 37,968 | 30,880 | 34,653 | 37,167 | 35,230 | 30,660 | 31,569 | 32,291 | 28,482 | 33,010 |
| 2010's | 39,834 | 37,482 | 38,071 | 38,244 | 37,957 | 38,282 | 40,988 | 40,161 | 42,251 | 41,122 |
| 2020's | 40,303 | 43,418 | 43,662 | 39,967 |
| - = No Data Reported; -- = Not Applicable; NA = Not Available; W = Withheld to avoid disclosure of individual company data. |
| Release Date: 8/30/2024 |
| Next Release Date: 8/29/2025 |