|
Download Data (XLS File) |
|
||||||||
|
||||||||
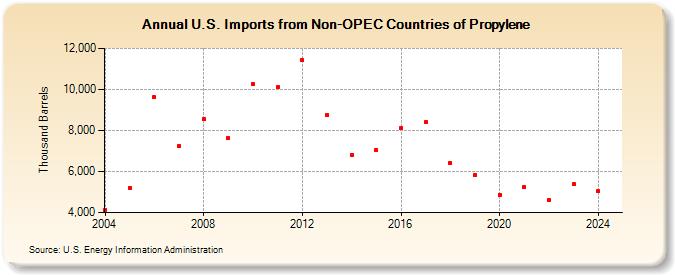
| U.S. Imports from Non-OPEC Countries of Propylene (Thousand Barrels) | ||||||||
| Decade | Year-0 | Year-1 | Year-2 | Year-3 | Year-4 | Year-5 | Year-6 | Year-7 | Year-8 | Year-9 |
|---|---|---|---|---|---|---|---|---|---|---|
| 2000's | 4,131 | 5,207 | 9,614 | 7,221 | 8,555 | 7,615 | ||||
| 2010's | 10,248 | 10,110 | 11,428 | 8,757 | 6,819 | 7,043 | 8,130 | 8,409 | 6,426 | 5,822 |
| 2020's | 4,875 | 5,243 | 4,611 | 5,397 |
| - = No Data Reported; -- = Not Applicable; NA = Not Available; W = Withheld to avoid disclosure of individual company data. |
| Release Date: 3/29/2024 |
| Next Release Date: 8/30/2024 |