|
Download Data (XLS File) |
|
||||||||
|
||||||||
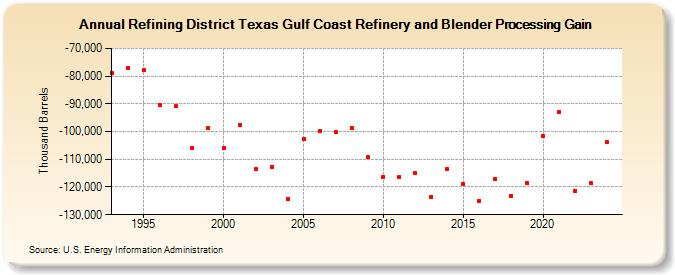
| Refining District Texas Gulf Coast Refinery and Blender Processing Gain (Thousand Barrels) | ||||||||
| Decade | Year-0 | Year-1 | Year-2 | Year-3 | Year-4 | Year-5 | Year-6 | Year-7 | Year-8 | Year-9 |
|---|---|---|---|---|---|---|---|---|---|---|
| 1990's | -78,827 | -77,087 | -77,871 | -90,313 | -90,788 | -105,757 | -98,726 | |||
| 2000's | -106,020 | -97,586 | -113,610 | -112,673 | -124,464 | -102,822 | -99,882 | -100,133 | -98,698 | -109,266 |
| 2010's | -116,370 | -116,372 | -115,076 | -123,452 | -113,539 | -118,867 | -124,883 | -117,098 | -123,244 | -118,479 |
| 2020's | -101,582 | -92,849 | -121,328 | -118,674 |
| - = No Data Reported; -- = Not Applicable; NA = Not Available; W = Withheld to avoid disclosure of individual company data. |
| Release Date: 8/30/2024 |
| Next Release Date: 8/29/2025 |