|
Download Data (XLS File) |
|
||||||||
|
||||||||
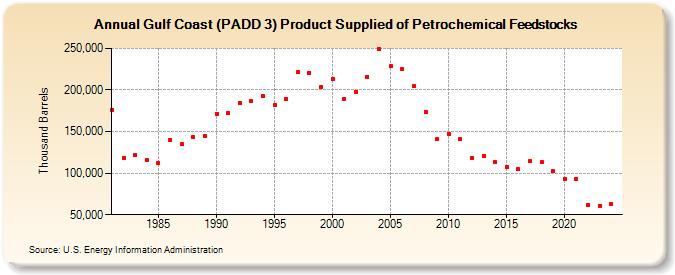
| Gulf Coast (PADD 3) Product Supplied of Petrochemical Feedstocks (Thousand Barrels) | ||||||||
| Decade | Year-0 | Year-1 | Year-2 | Year-3 | Year-4 | Year-5 | Year-6 | Year-7 | Year-8 | Year-9 |
|---|---|---|---|---|---|---|---|---|---|---|
| 1980's | 176,446 | 118,128 | 121,215 | 115,737 | 112,398 | 140,319 | 134,448 | 143,428 | 144,481 | |
| 1990's | 171,479 | 172,402 | 184,437 | 186,190 | 193,043 | 182,099 | 189,640 | 221,769 | 220,963 | 203,273 |
| 2000's | 212,766 | 189,366 | 197,899 | 216,008 | 249,044 | 228,379 | 224,784 | 204,417 | 173,943 | 140,582 |
| 2010's | 147,654 | 141,212 | 117,686 | 121,125 | 112,885 | 107,963 | 104,628 | 114,342 | 113,038 | 102,108 |
| 2020's | 92,380 | 92,621 | 61,274 | 62,536 |
| - = No Data Reported; -- = Not Applicable; NA = Not Available; W = Withheld to avoid disclosure of individual company data. |
| Release Date: 6/28/2024 |
| Next Release Date: 8/30/2024 |