|
Download Data (XLS File) |
|
||||||||
|
||||||||
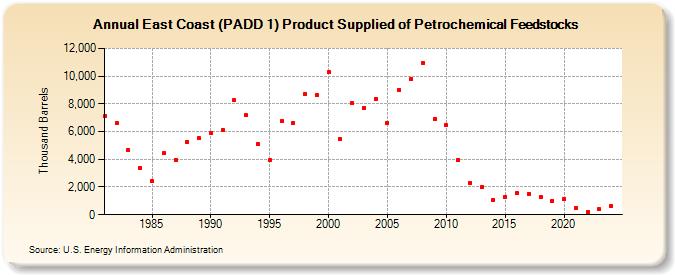
| East Coast (PADD 1) Product Supplied of Petrochemical Feedstocks (Thousand Barrels) | ||||||||
| Decade | Year-0 | Year-1 | Year-2 | Year-3 | Year-4 | Year-5 | Year-6 | Year-7 | Year-8 | Year-9 |
|---|---|---|---|---|---|---|---|---|---|---|
| 1980's | 7,090 | 6,632 | 4,649 | 3,402 | 2,423 | 4,467 | 3,972 | 5,233 | 5,499 | |
| 1990's | 5,897 | 6,104 | 8,246 | 7,163 | 5,104 | 3,942 | 6,779 | 6,640 | 8,704 | 8,606 |
| 2000's | 10,292 | 5,477 | 8,062 | 7,685 | 8,377 | 6,606 | 9,027 | 9,774 | 10,973 | 6,931 |
| 2010's | 6,454 | 3,964 | 2,314 | 1,996 | 1,080 | 1,308 | 1,546 | 1,503 | 1,291 | 1,025 |
| 2020's | 1,116 | 496 | 211 | 393 |
| - = No Data Reported; -- = Not Applicable; NA = Not Available; W = Withheld to avoid disclosure of individual company data. |
| Release Date: 8/30/2024 |
| Next Release Date: 8/29/2025 |