|
Download Data (XLS File) |
|
||||||||
|
||||||||
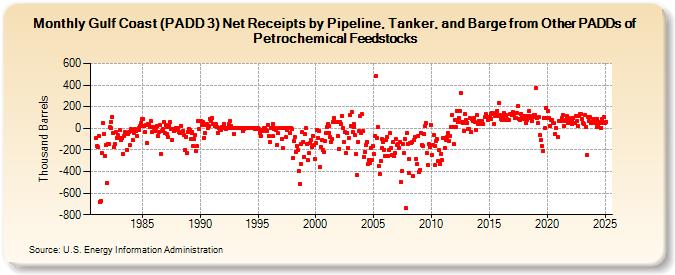
| Gulf Coast (PADD 3) Net Receipts by Pipeline, Tanker, and Barge from Other PADDs of Petrochemical Feedstocks (Thousand Barrels) | ||||||||
| Year | Jan | Feb | Mar | Apr | May | Jun | Jul | Aug | Sep | Oct | Nov | Dec |
|---|---|---|---|---|---|---|---|---|---|---|---|---|
| 1981 | -93 | -162 | -171 | -74 | -679 | -674 | -228 | 53 | -49 | -259 | -156 | -503 |
| 1982 | -143 | -147 | 9 | -1 | 59 | 108 | -48 | -174 | -148 | -37 | -86 | -65 |
| 1983 | -86 | -19 | -108 | -94 | -240 | -68 | -37 | -43 | -200 | -51 | -32 | -159 |
| 1984 | -9 | -26 | -112 | -47 | -10 | -28 | -69 | -19 | -20 | -1 | 17 | 52 |
| 1985 | 90 | 87 | 18 | -36 | 29 | -139 | 44 | 37 | 9 | 67 | -35 | 10 |
| 1986 | -28 | -27 | 2 | 21 | -71 | -37 | 28 | -235 | -28 | -10 | 61 | -46 |
| 1987 | 30 | 13 | -53 | -83 | 24 | 59 | -2 | -106 | -4 | -27 | -19 | 5 |
| 1988 | 6 | -1 | -36 | -46 | 25 | -42 | -24 | -62 | -203 | -77 | -227 | -31 |
| 1989 | -2 | -14 | -98 | -44 | -35 | -165 | -102 | -60 | -214 | -168 | 64 | -8 |
| 1990 | 71 | 70 | 29 | 58 | -87 | -48 | 29 | 39 | 0 | 20 | 82 | 67 |
| 1991 | 91 | 41 | 42 | 20 | 40 | 11 | -42 | 0 | 0 | -8 | -19 | 11 |
| 1992 | 0 | 44 | 0 | -9 | 0 | 0 | 40 | 69 | 20 | 0 | 0 | -49 |
| 1993 | 0 | 0 | 0 | 0 | 0 | 0 | 0 | 0 | -21 | -9 | 0 | 0 |
| 1994 | 0 | 0 | 0 | 0 | 0 | 0 | 0 | 0 | 0 | -10 | -10 | 0 |
| 1995 | 0 | -10 | -42 | -70 | -20 | -22 | 0 | 0 | -19 | -25 | 29 | -74 |
| 1996 | -126 | 0 | 0 | 40 | -74 | -9 | 0 | -20 | -151 | -48 | 0 | 0 |
| 1997 | 0 | -95 | -186 | 0 | 0 | -85 | -19 | 0 | 0 | -41 | 0 | -10 |
| 1998 | -278 | -120 | -84 | -220 | -160 | -200 | -391 | -513 | -147 | -328 | -36 | -123 |
| 1999 | -262 | -57 | 0 | -149 | -297 | -230 | -138 | -109 | -174 | -67 | -155 | -287 |
| 2000 | -138 | -18 | -87 | -29 | -359 | -175 | -109 | -205 | -215 | -121 | -46 | 9 |
| 2001 | 39 | 20 | -42 | -84 | -123 | -96 | 55 | 93 | 61 | 62 | 55 | -70 |
| 2002 | -188 | 59 | 38 | 116 | 2 | -129 | -34 | -231 | -41 | -181 | -88 | 120 |
| 2003 | 18 | 150 | -34 | 42 | 8 | -65 | -237 | -436 | -123 | -29 | 111 | -47 |
| 2004 | 129 | -26 | -262 | -221 | -156 | -126 | -330 | -290 | -318 | -181 | -295 | -166 |
| 2005 | -236 | -75 | 485 | -90 | 10 | -346 | -424 | -304 | -101 | -180 | -126 | -198 |
| 2006 | -258 | -109 | -80 | -253 | -202 | -48 | -179 | -247 | -125 | -261 | -228 | -103 |
| 2007 | -153 | -149 | -180 | -123 | -497 | -399 | -150 | -233 | -102 | -742 | -45 | -144 |
| 2008 | -411 | -284 | -138 | -138 | -130 | -442 | -107 | -81 | -285 | -328 | -72 | -407 |
| 2009 | -385 | -41 | -156 | -162 | -53 | 20 | 49 | -228 | -340 | -148 | -170 | 31 |
| 2010 | -243 | -154 | -59 | -343 | -166 | -120 | -102 | -307 | -205 | -326 | -234 | -296 |
| 2011 | -87 | -86 | -184 | -104 | -83 | -44 | -116 | -69 | 9 | 121 | 15 | -150 |
| 2012 | 80 | 8 | 163 | 58 | 98 | 162 | 325 | 60 | 59 | 48 | -23 | 129 |
| 2013 | 81 | 53 | -9 | -8 | 92 | -35 | 89 | 63 | 94 | 54 | -13 | 122 |
| 2014 | 41 | 72 | 42 | 70 | 66 | 40 | 104 | 129 | 81 | 106 | ||
| 2015 | 106 | 132 | 85 | 145 | 40 | 118 | 142 | 162 | 115 | 231 | 124 | |
| 2016 | 82 | 80 | 102 | 142 | 81 | 120 | 82 | 79 | 79 | 129 | 131 | 124 |
| 2017 | 152 | 127 | 97 | 143 | 94 | 140 | 206 | 90 | 81 | 135 | 103 | 112 |
| 2018 | 88 | 117 | 45 | 77 | 112 | 157 | 116 | 94 | 69 | 100 | 120 | 119 |
| 2019 | 375 | 92 | 46 | 102 | -66 | -109 | -165 | -211 | 91 | 97 | 1 | 192 |
| 2020 | 97 | 160 | 96 | 23 | 73 | 77 | 51 | 45 | -55 | 0 | -82 | |
| 2021 | 69 | 72 | 72 | 97 | 122 | 22 | 72 | 74 | 115 | 45 | 97 | 83 |
| 2022 | 64 | 74 | 42 | 97 | 48 | 49 | 117 | 71 | 19 | 113 | 129 | 130 |
| 2023 | 85 | 47 | 40 | 121 | 14 | -244 | 105 | 67 | 100 | 45 | 50 | 67 |
| 2024 | 90 | |||||||||||
| - = No Data Reported; -- = Not Applicable; NA = Not Available; W = Withheld to avoid disclosure of individual company data. |
| Release Date: 3/29/2024 |
| Next Release Date: 4/30/2024 |