|
Download Data (XLS File) |
|
||||||||
|
||||||||
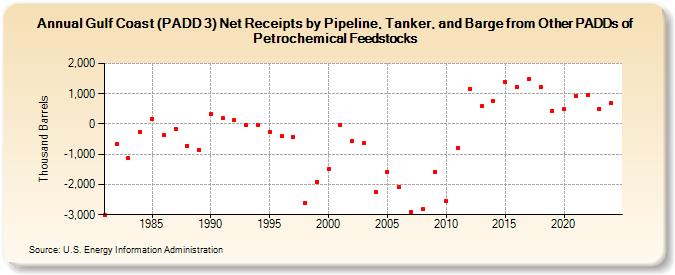
| Gulf Coast (PADD 3) Net Receipts by Pipeline, Tanker, and Barge from Other PADDs of Petrochemical Feedstocks (Thousand Barrels) | ||||||||
| Decade | Year-0 | Year-1 | Year-2 | Year-3 | Year-4 | Year-5 | Year-6 | Year-7 | Year-8 | Year-9 |
|---|---|---|---|---|---|---|---|---|---|---|
| 1980's | -2,995 | -673 | -1,137 | -272 | 181 | -370 | -163 | -718 | -846 | |
| 1990's | 330 | 187 | 115 | -30 | -20 | -253 | -388 | -436 | -2,600 | -1,925 |
| 2000's | -1,493 | -30 | -557 | -642 | -2,242 | -1,585 | -2,093 | -2,917 | -2,823 | -1,583 |
| 2010's | -2,555 | -778 | 1,167 | 583 | 751 | 1,400 | 1,231 | 1,480 | 1,214 | 445 |
| 2020's | 485 | 940 | 953 | 497 |
| - = No Data Reported; -- = Not Applicable; NA = Not Available; W = Withheld to avoid disclosure of individual company data. |
| Release Date: 3/29/2024 |
| Next Release Date: 8/30/2024 |