|
Download Data (XLS File) |
|
||||||||
|
||||||||
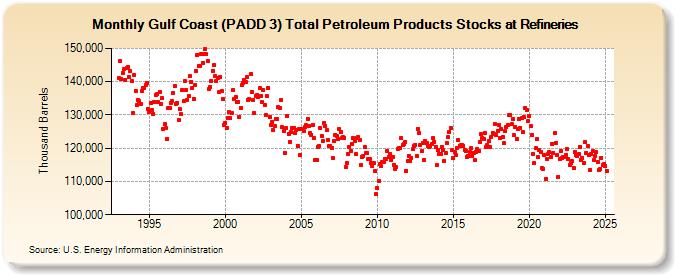
| Gulf Coast (PADD 3) Total Petroleum Products Stocks at Refineries (Thousand Barrels) | ||||||||
| Year | Jan | Feb | Mar | Apr | May | Jun | Jul | Aug | Sep | Oct | Nov | Dec |
|---|---|---|---|---|---|---|---|---|---|---|---|---|
| 1993 | 141,100 | 146,182 | 140,750 | 142,588 | 143,807 | 140,632 | 143,963 | 144,511 | 141,294 | 143,089 | 140,303 | 130,513 |
| 1994 | 142,011 | 137,259 | 132,982 | 134,465 | 134,053 | 133,213 | 137,233 | 138,218 | 138,042 | 138,985 | 139,732 | 131,800 |
| 1995 | 130,993 | 133,689 | 131,522 | 130,411 | 134,025 | 136,050 | 136,156 | 133,847 | 136,940 | 133,252 | 134,972 | 125,713 |
| 1996 | 127,168 | 126,025 | 122,897 | 131,931 | 132,166 | 133,532 | 134,150 | 136,641 | 138,680 | 133,379 | 133,726 | 128,447 |
| 1997 | 131,906 | 130,163 | 137,585 | 134,174 | 140,138 | 137,480 | 134,540 | 135,809 | 141,576 | 140,005 | 138,162 | 134,821 |
| 1998 | 139,080 | 143,157 | 148,118 | 144,740 | 144,839 | 148,310 | 145,752 | 148,293 | 149,734 | 148,243 | 146,158 | 137,642 |
| 1999 | 138,471 | 140,345 | 143,320 | 144,865 | 141,567 | 140,206 | 141,131 | 136,762 | 141,547 | 137,185 | 134,874 | 127,018 |
| 2000 | 127,547 | 126,171 | 129,192 | 130,849 | 128,976 | 130,589 | 137,369 | 134,655 | 135,319 | 133,737 | 134,008 | 129,461 |
| 2001 | 132,143 | 138,934 | 139,674 | 140,621 | 139,920 | 141,351 | 134,609 | 134,742 | 142,244 | 136,992 | 134,535 | 130,523 |
| 2002 | 135,739 | 136,061 | 135,392 | 138,010 | 135,808 | 133,872 | 137,346 | 133,091 | 130,072 | 135,573 | 138,237 | 129,265 |
| 2003 | 126,957 | 127,965 | 125,369 | 126,770 | 128,728 | 128,755 | 132,297 | 132,103 | 134,358 | 126,264 | 125,054 | 118,552 |
| 2004 | 126,008 | 129,555 | 124,374 | 121,950 | 124,795 | 126,124 | 126,037 | 124,656 | 125,590 | 120,745 | 125,659 | 118,097 |
| 2005 | 125,745 | 125,692 | 125,082 | 126,281 | 126,824 | 128,911 | 126,690 | 124,627 | 124,100 | 127,045 | 123,062 | 116,545 |
| 2006 | 116,381 | 120,489 | 120,739 | 125,972 | 123,676 | 122,304 | 127,688 | 126,786 | 125,395 | 122,498 | 120,509 | 120,596 |
| 2007 | 120,101 | 116,966 | 122,272 | 124,072 | 123,546 | 122,728 | 125,666 | 124,848 | 123,052 | 123,312 | 123,181 | 114,271 |
| 2008 | 115,632 | 118,330 | 120,442 | 119,134 | 121,328 | 123,029 | 122,141 | 118,178 | 123,024 | 123,248 | 122,361 | 114,931 |
| 2009 | 117,279 | 117,616 | 120,501 | 118,662 | 118,577 | 116,619 | 116,811 | 115,500 | 114,587 | 115,651 | 113,235 | 106,269 |
| 2010 | 107,956 | 110,208 | 115,101 | 114,511 | 115,772 | 115,983 | 116,858 | 116,856 | 119,179 | 117,380 | 118,269 | 116,583 |
| 2011 | 117,399 | 115,009 | 113,785 | 114,383 | 119,659 | 119,963 | 120,101 | 123,066 | 121,021 | 121,403 | 121,917 | 113,266 |
| 2012 | 116,046 | 117,783 | 116,072 | 117,149 | 119,716 | 120,698 | 121,086 | 117,793 | 125,909 | 124,436 | 121,069 | 119,079 |
| 2013 | 121,453 | 116,472 | 122,137 | 121,482 | 120,713 | 120,333 | 120,609 | 121,297 | 122,914 | 121,942 | 120,506 | 114,830 |
| 2014 | 119,565 | 118,141 | 118,208 | 120,481 | 119,312 | 116,267 | 118,509 | 121,569 | 123,297 | 124,878 | 126,100 | 119,433 |
| 2015 | 117,092 | 118,880 | 118,059 | 120,125 | 122,485 | 120,708 | 120,829 | 120,856 | 120,674 | 119,483 | 119,157 | 117,329 |
| 2016 | 117,651 | 118,881 | 119,966 | 117,770 | 118,693 | 116,339 | 118,913 | 119,758 | 119,133 | 121,832 | 124,381 | 123,092 |
| 2017 | 122,884 | 124,502 | 120,224 | 121,012 | 122,148 | 120,339 | 123,335 | 124,669 | 124,315 | 127,218 | 123,850 | 125,300 |
| 2018 | 127,010 | 123,194 | 125,791 | 123,242 | 121,474 | 125,086 | 126,296 | 126,955 | 129,887 | 130,088 | 127,127 | 128,868 |
| 2019 | 123,842 | 126,486 | 122,752 | 125,811 | 128,886 | 126,088 | 129,000 | 124,835 | 129,256 | 132,126 | 131,355 | 128,032 |
| 2020 | 129,665 | 126,520 | 123,995 | 118,375 | 115,528 | 119,972 | 122,634 | 117,329 | 119,345 | 118,737 | 113,936 | 113,752 |
| 2021 | 117,903 | 110,865 | 116,687 | 118,383 | 118,777 | 117,457 | 121,294 | 118,670 | 124,456 | 121,637 | 117,992 | 111,418 |
| 2022 | 116,674 | 119,042 | 116,976 | 117,346 | 117,328 | 118,068 | 119,648 | 116,711 | 114,947 | 115,441 | 116,018 | 114,116 |
| 2023 | 118,958 | 117,971 | 117,591 | 118,217 | 120,400 | 116,464 | 117,188 | 115,561 | 121,819 | 118,672 | 120,653 | 117,960 |
| 2024 | 113,546 | 118,194 | 119,065 | 116,527 | 117,661 | 118,793 | 115,904 | 113,336 | 113,814 | 117,195 | 114,947 | 115,119 |
| 2025 | 114,628 | 113,249 | 115,775 | 118,085 | ||||||||
| - = No Data Reported; -- = Not Applicable; NA = Not Available; W = Withheld to avoid disclosure of individual company data. |
| Release Date: 6/30/2025 |
| Next Release Date: 7/31/2025 |