|
Download Data (XLS File) |
|
||||||||
|
||||||||
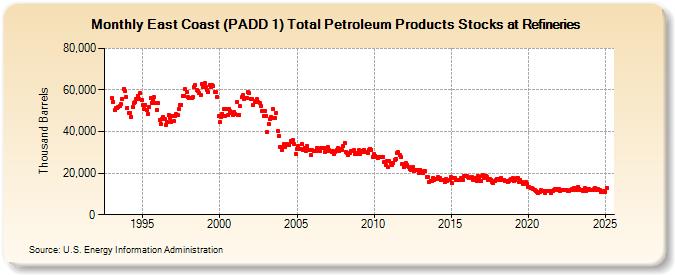
| East Coast (PADD 1) Total Petroleum Products Stocks at Refineries (Thousand Barrels) | ||||||||
| Year | Jan | Feb | Mar | Apr | May | Jun | Jul | Aug | Sep | Oct | Nov | Dec |
|---|---|---|---|---|---|---|---|---|---|---|---|---|
| 1993 | 56,177 | 54,416 | 50,222 | 51,240 | 51,394 | 51,616 | 52,370 | 53,154 | 55,558 | 60,607 | 59,302 | 56,858 |
| 1994 | 51,341 | 49,084 | 49,068 | 47,093 | 51,774 | 53,741 | 54,046 | 55,545 | 57,295 | 55,693 | 58,468 | 55,022 |
| 1995 | 52,644 | 50,768 | 52,797 | 50,150 | 48,375 | 51,838 | 56,096 | 53,874 | 55,226 | 56,382 | 53,511 | 50,550 |
| 1996 | 53,604 | 45,528 | 43,616 | 45,951 | 47,217 | 45,983 | 43,392 | 44,650 | 47,820 | 46,727 | 44,604 | 47,387 |
| 1997 | 45,066 | 47,246 | 48,376 | 47,886 | 50,871 | 52,823 | 52,933 | 56,987 | 57,340 | 60,262 | 58,880 | 56,576 |
| 1998 | 56,130 | 56,078 | 56,183 | 56,578 | 61,414 | 62,173 | 59,817 | 59,443 | 58,561 | 57,544 | 62,888 | 61,529 |
| 1999 | 63,161 | 61,261 | 60,209 | 58,811 | 62,463 | 61,421 | 62,324 | 61,819 | 59,192 | 58,811 | 56,778 | 47,375 |
| 2000 | 44,441 | 46,896 | 48,591 | 50,608 | 47,439 | 50,622 | 47,750 | 50,782 | 49,734 | 48,852 | 47,843 | 49,455 |
| 2001 | 48,405 | 54,023 | 48,109 | 48,024 | 52,132 | 56,438 | 57,671 | 55,581 | 56,175 | 56,300 | 58,973 | 58,376 |
| 2002 | 55,849 | 55,703 | 52,719 | 54,346 | 54,905 | 55,468 | 54,216 | 53,883 | 52,508 | 49,658 | 47,492 | 49,995 |
| 2003 | 47,612 | 39,892 | 43,704 | 45,936 | 47,006 | 50,860 | 46,574 | 46,707 | 49,105 | 40,053 | 37,847 | 32,809 |
| 2004 | 31,031 | 32,331 | 33,810 | 32,708 | 33,933 | 33,526 | 33,597 | 35,473 | 35,057 | 35,770 | 33,816 | 29,259 |
| 2005 | 31,591 | 33,091 | 31,403 | 31,514 | 34,065 | 31,177 | 32,286 | 30,814 | 33,022 | 31,041 | 31,127 | 28,504 |
| 2006 | 30,932 | 30,497 | 30,590 | 30,749 | 32,266 | 31,315 | 30,543 | 32,311 | 31,941 | 32,264 | 30,341 | 30,835 |
| 2007 | 32,676 | 30,974 | 30,853 | 30,042 | 30,457 | 29,335 | 30,227 | 31,124 | 31,859 | 30,673 | 31,763 | 30,946 |
| 2008 | 33,196 | 34,677 | 30,394 | 29,475 | 28,491 | 29,792 | 30,844 | 30,733 | 30,968 | 29,406 | 29,462 | 29,392 |
| 2009 | 30,938 | 29,380 | 30,593 | 30,171 | 31,353 | 30,021 | 30,134 | 29,758 | 31,261 | 31,688 | 31,342 | 27,940 |
| 2010 | 29,018 | 28,368 | 27,849 | 27,052 | 27,524 | 27,597 | 27,846 | 27,689 | 25,329 | 23,898 | 25,894 | 22,919 |
| 2011 | 25,842 | 24,892 | 24,144 | 24,793 | 26,201 | 27,032 | 29,689 | 30,005 | 28,566 | 27,968 | 24,607 | 23,016 |
| 2012 | 23,417 | 24,743 | 24,103 | 22,884 | 22,093 | 21,281 | 22,977 | 20,919 | 21,307 | 21,354 | 21,427 | 20,181 |
| 2013 | 21,669 | 20,561 | 20,184 | 20,977 | 20,873 | 18,116 | 18,038 | 15,895 | 16,380 | 16,348 | 17,842 | 16,921 |
| 2014 | 17,030 | 16,988 | 18,005 | 17,486 | 16,545 | 16,898 | 16,874 | 15,850 | 17,086 | 16,281 | 16,569 | 16,806 |
| 2015 | 17,918 | 15,146 | 17,496 | 17,506 | 16,703 | 16,875 | 16,831 | 16,702 | 17,499 | 16,664 | 18,453 | 18,647 |
| 2016 | 18,407 | 18,005 | 17,896 | 17,754 | 18,285 | 16,713 | 16,857 | 17,687 | 16,333 | 18,565 | 17,846 | 15,979 |
| 2017 | 18,552 | 18,964 | 17,812 | 18,808 | 18,287 | 16,790 | 17,096 | 16,755 | 15,886 | 15,427 | 16,288 | 16,662 |
| 2018 | 17,350 | 17,152 | 16,842 | 17,799 | 16,838 | 16,510 | 16,183 | 16,391 | 15,679 | 16,384 | 16,789 | 16,992 |
| 2019 | 17,520 | 16,424 | 16,923 | 17,476 | 17,500 | 15,898 | 16,614 | 15,800 | 14,677 | 15,301 | 15,562 | 14,817 |
| 2020 | 13,198 | 13,284 | 12,917 | 12,618 | 12,544 | 12,105 | 11,332 | 11,058 | 10,404 | 11,022 | 11,720 | 11,284 |
| 2021 | 11,441 | 10,666 | 11,400 | 11,378 | 11,596 | 11,381 | 10,582 | 11,496 | 11,850 | 12,144 | 12,504 | 12,065 |
| 2022 | 12,424 | 11,465 | 11,820 | 12,085 | 11,741 | 11,675 | 11,874 | 11,538 | 11,422 | 12,074 | 12,150 | 11,743 |
| 2023 | 12,954 | 12,914 | 11,881 | 13,355 | 12,576 | 11,859 | 11,901 | 11,233 | 12,660 | 11,463 | 12,388 | 12,264 |
| 2024 | 11,966 | 11,752 | 11,864 | 12,173 | ||||||||
| - = No Data Reported; -- = Not Applicable; NA = Not Available; W = Withheld to avoid disclosure of individual company data. |
| Release Date: 6/28/2024 |
| Next Release Date: 7/31/2024 |