|
Download Data (XLS File) |
|
||||||||
|
||||||||
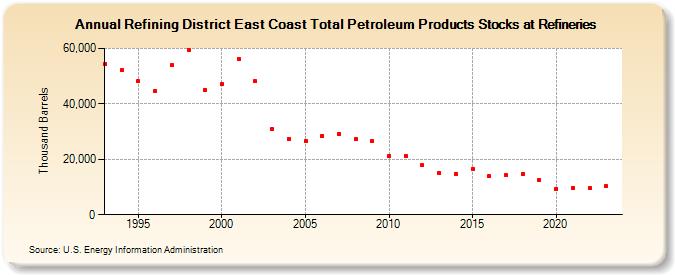
| Refining District East Coast Total Petroleum Products Stocks at Refineries (Thousand Barrels) | ||||||||
| Decade | Year-0 | Year-1 | Year-2 | Year-3 | Year-4 | Year-5 | Year-6 | Year-7 | Year-8 | Year-9 |
|---|---|---|---|---|---|---|---|---|---|---|
| 1990's | 54,388 | 52,183 | 48,076 | 44,777 | 53,974 | 59,540 | 45,079 | |||
| 2000's | 47,069 | 56,341 | 48,117 | 30,818 | 27,328 | 26,523 | 28,531 | 29,055 | 27,306 | 26,425 |
| 2010's | 21,274 | 21,185 | 17,842 | 14,987 | 14,732 | 16,501 | 13,823 | 14,234 | 14,616 | 12,531 |
| 2020's | 9,389 | 9,793 | 9,613 | 10,189 |
| - = No Data Reported; -- = Not Applicable; NA = Not Available; W = Withheld to avoid disclosure of individual company data. |
| Release Date: 3/29/2024 |
| Next Release Date: 8/30/2024 |
Referring Pages: