|
Download Data (XLS File) |
|
||||||||
|
||||||||
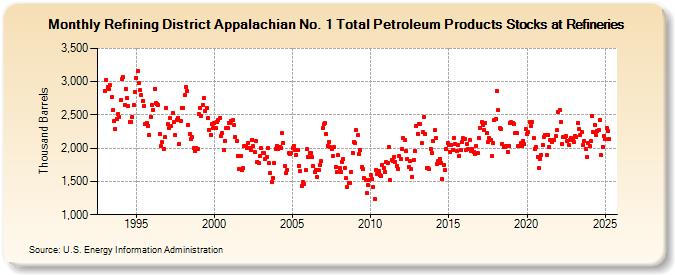
| Refining District Appalachian No. 1 Total Petroleum Products Stocks at Refineries (Thousand Barrels) | ||||||||
| Year | Jan | Feb | Mar | Apr | May | Jun | Jul | Aug | Sep | Oct | Nov | Dec |
|---|---|---|---|---|---|---|---|---|---|---|---|---|
| 1993 | 2,865 | 3,031 | 2,924 | 2,893 | 2,943 | 2,762 | 2,569 | 2,412 | 2,289 | 2,442 | 2,515 | 2,470 |
| 1994 | 2,721 | 3,033 | 3,064 | 2,652 | 2,896 | 2,755 | 2,628 | 2,397 | 2,391 | 2,464 | 2,651 | 2,839 |
| 1995 | 3,060 | 3,155 | 2,983 | 2,874 | 2,803 | 2,716 | 2,636 | 2,359 | 2,383 | 2,338 | 2,201 | 2,474 |
| 1996 | 2,653 | 2,576 | 2,890 | 2,684 | 2,661 | 2,650 | 2,220 | 2,030 | 2,089 | 1,990 | 2,163 | 2,610 |
| 1997 | 2,361 | 2,303 | 2,448 | 2,329 | 2,523 | 2,394 | 2,195 | 2,431 | 2,461 | 2,067 | 2,409 | 2,602 |
| 1998 | 2,604 | 2,794 | 2,917 | 2,857 | 2,346 | 2,215 | 2,138 | 2,161 | 2,000 | 1,964 | 2,007 | 1,989 |
| 1999 | 2,517 | 2,603 | 2,485 | 2,647 | 2,761 | 2,561 | 2,603 | 2,456 | 2,280 | 2,200 | 2,359 | 2,296 |
| 2000 | 2,385 | 2,304 | 2,396 | 2,425 | 2,453 | 2,190 | 2,232 | 1,977 | 2,107 | 2,301 | 2,299 | 2,386 |
| 2001 | 2,381 | 2,414 | 2,419 | 2,346 | 2,167 | 2,111 | 1,885 | 1,684 | 1,880 | 1,671 | 1,696 | 2,035 |
| 2002 | 2,039 | 1,996 | 2,079 | 2,003 | 1,974 | 2,129 | 2,028 | 1,941 | 2,106 | 1,798 | 1,773 | 1,878 |
| 2003 | 1,997 | 1,933 | 1,934 | 1,833 | 1,871 | 1,996 | 1,772 | 1,625 | 1,485 | 1,557 | 1,776 | 1,991 |
| 2004 | 2,038 | 1,985 | 2,023 | 2,005 | 2,222 | 2,075 | 1,727 | 1,634 | 1,677 | 1,928 | 1,913 | 1,931 |
| 2005 | 2,002 | 2,037 | 1,974 | 1,899 | 1,971 | 1,736 | 1,650 | 1,438 | 1,488 | 1,469 | 1,667 | 1,981 |
| 2006 | 1,866 | 1,927 | 1,929 | 1,865 | 1,734 | 1,644 | 1,669 | 1,567 | 1,668 | 1,746 | 1,801 | 2,304 |
| 2007 | 2,363 | 2,376 | 2,217 | 2,039 | 2,098 | 2,016 | 1,983 | 1,885 | 2,012 | 1,716 | 1,644 | 1,891 |
| 2008 | 1,701 | 1,641 | 1,797 | 1,833 | 1,707 | 1,545 | 1,414 | 1,476 | 1,475 | 1,639 | 1,933 | 2,086 |
| 2009 | 2,076 | 2,268 | 2,192 | 1,920 | 1,972 | 1,711 | 1,683 | 1,549 | 1,524 | 1,320 | 1,448 | 1,515 |
| 2010 | 1,590 | 1,531 | 1,418 | 1,240 | 1,673 | 1,611 | 1,657 | 1,591 | 1,576 | 1,746 | 1,698 | 1,645 |
| 2011 | 1,792 | 1,775 | 2,018 | 1,518 | 1,819 | 1,806 | 1,873 | 1,798 | 1,726 | 1,686 | 1,878 | 1,831 |
| 2012 | 1,985 | 2,146 | 2,130 | 1,953 | 1,842 | 1,723 | 1,801 | 1,687 | 1,572 | 1,820 | 1,954 | 2,339 |
| 2013 | 2,218 | 2,365 | 2,364 | 2,072 | 2,240 | 2,469 | 2,213 | 1,699 | 1,697 | 1,681 | 1,987 | 1,934 |
| 2014 | 2,101 | 2,269 | 2,151 | 1,765 | 1,803 | 1,844 | 1,776 | 1,536 | 1,744 | 1,668 | 1,987 | 2,074 |
| 2015 | 2,042 | 1,937 | 2,053 | 1,968 | 2,160 | 2,057 | 1,959 | 2,049 | 1,884 | 1,966 | 2,086 | 2,146 |
| 2016 | 2,136 | 1,968 | 2,062 | 1,985 | 2,119 | 1,960 | 1,982 | 1,942 | 1,918 | 2,038 | 1,935 | 2,156 |
| 2017 | 2,300 | 2,391 | 2,354 | 2,271 | 2,383 | 2,225 | 2,089 | 2,153 | 2,121 | 1,879 | 2,079 | 2,428 |
| 2018 | 2,439 | 2,859 | 2,568 | 2,305 | 2,283 | 2,068 | 2,014 | 2,011 | 2,040 | 1,950 | 2,037 | 2,376 |
| 2019 | 2,393 | 2,383 | 2,357 | 2,235 | 2,235 | 2,027 | 2,040 | 2,076 | 2,040 | 2,109 | 2,059 | 2,286 |
| 2020 | 2,216 | 2,239 | 2,390 | 2,335 | 2,396 | 2,156 | 1,992 | 2,011 | 1,874 | 1,700 | 1,843 | 1,895 |
| 2021 | 2,052 | 2,172 | 2,202 | 1,899 | 2,199 | 2,025 | 2,119 | 2,096 | 2,116 | 2,121 | 2,183 | 2,272 |
| 2022 | 2,545 | 2,567 | 2,397 | 2,068 | 2,168 | 2,173 | 2,186 | 2,110 | 2,052 | 2,117 | 2,147 | 2,130 |
| 2023 | 2,089 | 2,178 | 2,165 | 2,381 | 2,285 | 2,202 | 2,249 | 2,046 | 2,110 | 1,984 | 1,866 | 2,075 |
| 2024 | 2,028 | |||||||||||
| - = No Data Reported; -- = Not Applicable; NA = Not Available; W = Withheld to avoid disclosure of individual company data. |
| Release Date: 3/29/2024 |
| Next Release Date: 4/30/2024 |
Referring Pages: