|
Download Data (XLS File) |
|
||||||||
|
||||||||
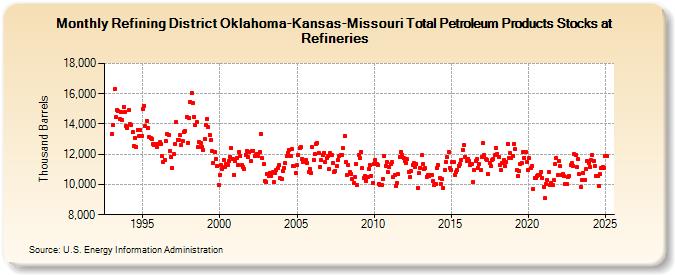
| Refining District Oklahoma-Kansas-Missouri Total Petroleum Products Stocks at Refineries (Thousand Barrels) | ||||||||
| Year | Jan | Feb | Mar | Apr | May | Jun | Jul | Aug | Sep | Oct | Nov | Dec |
|---|---|---|---|---|---|---|---|---|---|---|---|---|
| 1993 | 13,353 | 13,931 | 16,292 | 14,442 | 14,943 | 14,856 | 14,318 | 14,764 | 14,256 | 15,145 | 14,816 | 13,844 |
| 1994 | 13,750 | 14,908 | 13,969 | 13,950 | 13,446 | 12,558 | 13,075 | 12,501 | 13,623 | 13,210 | 13,592 | 13,221 |
| 1995 | 15,008 | 15,221 | 13,835 | 14,224 | 13,739 | 13,127 | 13,050 | 12,979 | 12,669 | 12,588 | 12,677 | 12,478 |
| 1996 | 12,694 | 12,776 | 12,660 | 11,878 | 11,505 | 11,637 | 12,869 | 13,368 | 13,274 | 12,235 | 11,827 | 11,120 |
| 1997 | 12,005 | 12,676 | 14,127 | 12,959 | 12,931 | 13,254 | 12,594 | 12,874 | 13,464 | 13,539 | 14,460 | 12,775 |
| 1998 | 14,376 | 15,469 | 16,077 | 15,364 | 14,480 | 13,950 | 14,131 | 12,493 | 12,838 | 12,753 | 12,470 | 12,258 |
| 1999 | 12,978 | 13,919 | 14,353 | 13,786 | 13,276 | 12,963 | 12,196 | 11,429 | 12,133 | 11,712 | 11,220 | 9,994 |
| 2000 | 10,635 | 11,287 | 11,041 | 11,615 | 11,179 | 11,378 | 11,300 | 11,540 | 11,841 | 12,443 | 11,674 | 10,659 |
| 2001 | 11,562 | 11,718 | 11,309 | 12,167 | 11,875 | 11,263 | 11,180 | 11,037 | 11,977 | 12,246 | 11,813 | 12,156 |
| 2002 | 11,550 | 12,240 | 12,224 | 11,861 | 11,977 | 12,021 | 11,909 | 12,151 | 13,364 | 11,734 | 11,322 | 10,211 |
| 2003 | 10,178 | 10,704 | 10,541 | 10,740 | 10,589 | 10,798 | 10,163 | 10,775 | 10,965 | 11,098 | 11,286 | 10,399 |
| 2004 | 10,347 | 10,888 | 11,057 | 11,402 | 11,858 | 12,107 | 12,298 | 11,865 | 12,342 | 11,197 | 11,245 | 10,759 |
| 2005 | 11,265 | 11,959 | 12,441 | 12,491 | 11,674 | 11,470 | 11,581 | 11,643 | 11,452 | 10,808 | 11,042 | 10,769 |
| 2006 | 12,455 | 11,650 | 11,997 | 12,679 | 12,744 | 12,056 | 11,187 | 11,591 | 11,940 | 12,112 | 11,505 | 11,724 |
| 2007 | 11,896 | 11,029 | 12,060 | 11,948 | 11,446 | 10,847 | 10,895 | 11,250 | 11,622 | 11,889 | 11,970 | 11,950 |
| 2008 | 12,392 | 13,219 | 11,490 | 10,642 | 11,281 | 10,812 | 10,718 | 10,352 | 10,070 | 10,502 | 11,345 | 9,983 |
| 2009 | 11,965 | 11,724 | 12,173 | 11,077 | 10,458 | 10,592 | 10,231 | 10,462 | 11,040 | 11,295 | 10,587 | 10,070 |
| 2010 | 11,325 | 11,646 | 11,355 | 11,284 | 10,064 | 9,986 | 9,967 | 10,356 | 11,880 | 11,254 | 11,504 | 10,802 |
| 2011 | 11,128 | 11,322 | 11,479 | 10,513 | 10,640 | 9,900 | 10,116 | 10,669 | 11,829 | 12,165 | 11,959 | 11,726 |
| 2012 | 11,519 | 11,411 | 11,667 | 10,840 | 10,479 | 10,871 | 11,293 | 11,388 | 11,129 | 11,378 | 9,799 | 10,741 |
| 2013 | 11,116 | 11,918 | 11,341 | 11,026 | 11,060 | 10,523 | 10,620 | 10,554 | 10,637 | 10,631 | 10,203 | 9,963 |
| 2014 | 10,063 | 11,120 | 11,259 | 10,398 | 10,061 | 10,339 | 9,783 | 10,949 | 11,492 | 11,799 | 12,150 | 11,111 |
| 2015 | 10,981 | 11,504 | 11,472 | 10,632 | 10,848 | 10,973 | 11,248 | 11,347 | 11,647 | 12,301 | 12,622 | 11,832 |
| 2016 | 11,576 | 11,708 | 11,583 | 11,267 | 11,342 | 10,164 | 10,934 | 11,550 | 11,668 | 11,089 | 11,330 | 10,978 |
| 2017 | 11,829 | 12,711 | 11,940 | 11,700 | 11,628 | 10,679 | 11,425 | 11,211 | 11,644 | 11,697 | 11,922 | 12,444 |
| 2018 | 12,035 | 11,786 | 11,305 | 10,952 | 11,437 | 11,612 | 11,192 | 11,494 | 12,701 | 11,736 | 12,055 | 11,783 |
| 2019 | 11,864 | 12,700 | 12,323 | 10,950 | 10,540 | 10,869 | 11,343 | 11,417 | 12,131 | 11,772 | 12,148 | 11,460 |
| 2020 | 10,946 | 11,721 | 11,075 | 11,240 | 9,712 | 10,431 | 10,427 | 10,533 | 10,640 | 10,641 | 10,844 | 10,431 |
| 2021 | 9,820 | 9,073 | 10,007 | 10,285 | 10,834 | 9,974 | 10,120 | 9,992 | 10,274 | 11,335 | 11,752 | 10,617 |
| 2022 | 11,533 | 11,201 | 10,658 | 10,673 | 10,528 | 9,999 | 10,009 | 10,520 | 10,560 | 11,286 | 11,403 | 11,246 |
| 2023 | 11,981 | 11,926 | 11,251 | 11,660 | 10,665 | 9,836 | 10,311 | 10,762 | 10,302 | 11,015 | 11,569 | 11,418 |
| 2024 | 11,186 | |||||||||||
| - = No Data Reported; -- = Not Applicable; NA = Not Available; W = Withheld to avoid disclosure of individual company data. |
| Release Date: 3/29/2024 |
| Next Release Date: 4/30/2024 |