|
Download Data (XLS File) |
|
||||||||
|
||||||||
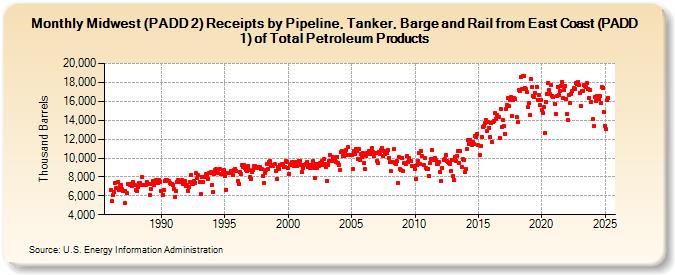
| Midwest (PADD 2) Receipts by Pipeline, Tanker, Barge and Rail from East Coast (PADD 1) of Total Petroleum Products (Thousand Barrels) | ||||||||
| Year | Jan | Feb | Mar | Apr | May | Jun | Jul | Aug | Sep | Oct | Nov | Dec |
|---|---|---|---|---|---|---|---|---|---|---|---|---|
| 1986 | 6,627 | 5,406 | 6,042 | 6,414 | 7,350 | 6,852 | 6,838 | 7,492 | 6,625 | 7,005 | 7,147 | 6,681 |
| 1987 | 6,557 | 5,230 | 6,460 | 6,322 | 7,266 | 7,274 | 7,183 | 7,230 | 7,039 | 7,441 | 7,095 | 7,115 |
| 1988 | 6,602 | 6,494 | 6,967 | 7,384 | 7,340 | 7,122 | 7,959 | 7,188 | 7,166 | 7,161 | 7,497 | 7,222 |
| 1989 | 7,279 | 6,101 | 6,740 | 7,298 | 7,560 | 7,186 | 7,528 | 7,655 | 7,643 | 7,383 | 7,679 | 7,511 |
| 1990 | 6,498 | 6,134 | 6,636 | 7,552 | 7,705 | 7,651 | 7,524 | 7,616 | 7,400 | 7,211 | 7,289 | 7,154 |
| 1991 | 6,721 | 5,908 | 6,480 | 7,454 | 7,704 | 7,566 | 7,453 | 7,626 | 7,258 | 7,267 | 7,534 | 7,007 |
| 1992 | 7,133 | 6,542 | 6,976 | 7,488 | 8,203 | 7,336 | 7,281 | 7,572 | 7,382 | 8,373 | 7,843 | 8,177 |
| 1993 | 7,473 | 6,152 | 7,995 | 7,444 | 8,027 | 7,946 | 8,260 | 8,071 | 7,802 | 8,393 | 8,394 | 8,571 |
| 1994 | 7,125 | 6,408 | 8,339 | 8,688 | 8,822 | 8,516 | 8,372 | 8,812 | 8,359 | 8,323 | 8,425 | 8,724 |
| 1995 | 8,143 | 6,655 | 8,399 | 8,443 | 8,369 | 8,460 | 8,674 | 8,621 | 8,160 | 8,716 | 8,840 | 8,651 |
| 1996 | 7,545 | 7,248 | 8,554 | 8,273 | 9,233 | 9,088 | 9,280 | 8,942 | 8,755 | 8,583 | 9,159 | 8,778 |
| 1997 | 8,027 | 7,827 | 8,509 | 8,745 | 9,167 | 9,105 | 8,959 | 9,048 | 9,014 | 9,090 | 8,793 | 8,800 |
| 1998 | 8,045 | 7,354 | 8,364 | 8,751 | 9,317 | 8,810 | 9,576 | 9,666 | 9,146 | 9,233 | 9,123 | 9,333 |
| 1999 | 8,658 | 7,746 | 9,015 | 8,867 | 9,264 | 9,242 | 9,336 | 9,335 | 9,032 | 9,050 | 9,682 | 9,605 |
| 2000 | 8,894 | 8,346 | 9,286 | 9,346 | 9,526 | 9,115 | 9,553 | 9,588 | 9,124 | 9,531 | 9,695 | 9,690 |
| 2001 | 9,264 | 8,500 | 8,951 | 9,213 | 9,279 | 9,334 | 9,611 | 9,004 | 9,239 | 8,989 | 9,267 | 9,655 |
| 2002 | 8,930 | 7,840 | 9,350 | 8,977 | 9,325 | 9,192 | 9,487 | 9,243 | 9,668 | 9,283 | 9,866 | 9,320 |
| 2003 | 9,039 | 7,571 | 9,271 | 9,728 | 10,274 | 9,646 | 10,126 | 10,016 | 9,995 | 9,554 | 10,143 | 9,476 |
| 2004 | 9,259 | 8,748 | 10,654 | 10,694 | 10,231 | 10,220 | 10,609 | 10,868 | 10,272 | 11,120 | 10,274 | 10,283 |
| 2005 | 10,309 | 8,824 | 10,700 | 10,455 | 10,981 | 10,747 | 9,899 | 10,944 | 9,770 | 10,474 | 10,154 | 10,523 |
| 2006 | 9,521 | 8,828 | 10,249 | 10,477 | 10,758 | 10,425 | 10,700 | 11,055 | 10,609 | 10,175 | 10,527 | 10,520 |
| 2007 | 9,685 | 9,421 | 10,673 | 10,458 | 10,893 | 11,045 | 10,243 | 10,755 | 10,454 | 10,562 | 10,822 | 9,953 |
| 2008 | 9,535 | 8,597 | 9,628 | 9,603 | 10,923 | 9,463 | 9,414 | 9,663 | 7,399 | 10,073 | 8,804 | 8,684 |
| 2009 | 9,953 | 8,583 | 9,472 | 9,360 | 10,206 | 9,602 | 10,042 | 9,674 | 9,651 | 9,165 | 9,156 | 9,130 |
| 2010 | 8,798 | 7,754 | 9,254 | 9,644 | 10,488 | 9,344 | 10,752 | 10,174 | 9,270 | 10,018 | 8,954 | 8,808 |
| 2011 | 8,878 | 8,085 | 9,465 | 9,880 | 10,806 | 9,851 | 9,794 | 10,041 | 9,754 | 9,353 | 9,413 | 9,575 |
| 2012 | 8,543 | 7,558 | 8,947 | 9,794 | 9,918 | 10,349 | 9,679 | 9,602 | 9,493 | 9,394 | 8,662 | 9,775 |
| 2013 | 8,047 | 7,684 | 10,106 | 9,713 | 10,191 | 10,716 | 9,475 | 10,716 | 9,088 | 9,893 | 9,762 | 8,491 |
| 2014 | 8,859 | 10,950 | 11,952 | 11,485 | 11,947 | 11,449 | 11,352 | 11,686 | 11,437 | 12,288 | 12,189 | 12,524 |
| 2015 | 11,373 | 10,312 | 11,318 | 12,259 | 13,287 | 13,368 | 13,670 | 14,000 | 12,887 | 13,772 | 13,227 | 12,206 |
| 2016 | 13,678 | 11,707 | 13,780 | 13,863 | 14,747 | 14,162 | 14,511 | 14,359 | 12,131 | 15,212 | 13,231 | 13,994 |
| 2017 | 13,359 | 12,541 | 15,155 | 15,639 | 16,327 | 15,481 | 16,126 | 16,469 | 14,485 | 16,091 | 16,340 | 16,255 |
| 2018 | 14,300 | 13,814 | 17,156 | 17,118 | 18,554 | 17,278 | 18,692 | 18,676 | 17,354 | 17,304 | 16,930 | 15,392 |
| 2019 | 15,788 | 14,557 | 18,342 | 17,491 | 16,596 | 16,461 | 16,881 | 17,539 | 16,174 | 16,663 | 15,615 | 16,148 |
| 2020 | 15,109 | 14,735 | 15,366 | 12,604 | 15,974 | 16,803 | 17,911 | 17,182 | 16,725 | 17,707 | 16,587 | 16,430 |
| 2021 | 15,737 | 14,701 | 16,564 | 17,554 | 16,674 | 17,049 | 17,665 | 18,048 | 16,358 | 17,235 | 17,610 | 16,208 |
| 2022 | 14,686 | 14,046 | 16,713 | 15,847 | 16,801 | 17,102 | 17,370 | 17,256 | 17,913 | 17,825 | 18,050 | 17,743 |
| 2023 | 16,869 | 15,506 | 17,050 | 17,143 | 17,751 | 17,620 | 17,491 | 17,964 | 17,260 | 16,341 | 17,188 | 15,945 |
| 2024 | 14,316 | |||||||||||
| - = No Data Reported; -- = Not Applicable; NA = Not Available; W = Withheld to avoid disclosure of individual company data. |
| Release Date: 3/29/2024 |
| Next Release Date: 4/30/2024 |