|
Download Data (XLS File) |
|
||||||||
|
||||||||
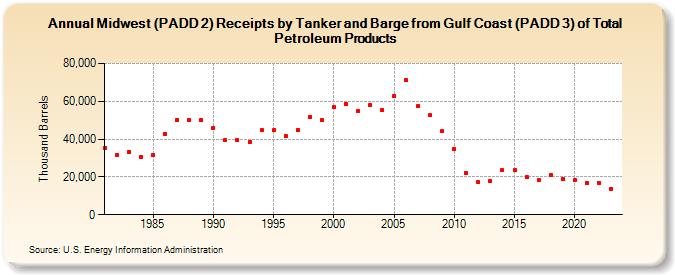
| Midwest (PADD 2) Receipts by Tanker and Barge from Gulf Coast (PADD 3) of Total Petroleum Products (Thousand Barrels) | ||||||||
| Decade | Year-0 | Year-1 | Year-2 | Year-3 | Year-4 | Year-5 | Year-6 | Year-7 | Year-8 | Year-9 |
|---|---|---|---|---|---|---|---|---|---|---|
| 1980's | 35,501 | 31,792 | 33,364 | 30,719 | 31,395 | 42,834 | 50,125 | 49,887 | 49,955 | |
| 1990's | 45,955 | 39,393 | 39,279 | 38,539 | 44,551 | 44,553 | 41,508 | 44,977 | 51,604 | 50,036 |
| 2000's | 56,741 | 58,826 | 54,814 | 58,009 | 55,321 | 62,655 | 71,087 | 57,350 | 52,492 | 44,067 |
| 2010's | 34,554 | 21,954 | 17,098 | 17,944 | 23,429 | 23,535 | 19,831 | 18,184 | 20,941 | 18,872 |
| 2020's | 18,137 | 16,769 | 17,029 | 13,769 |
| - = No Data Reported; -- = Not Applicable; NA = Not Available; W = Withheld to avoid disclosure of individual company data. |
| Release Date: 3/29/2024 |
| Next Release Date: 8/30/2024 |