|
Download Data (XLS File) |
|
||||||||
|
||||||||
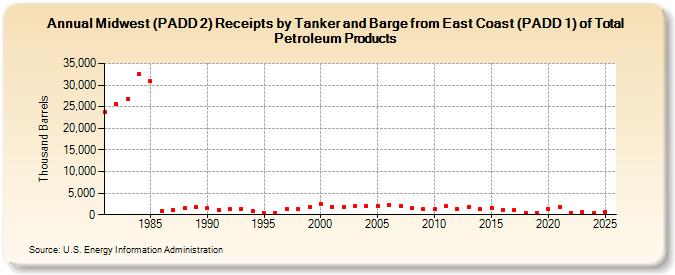
| Midwest (PADD 2) Receipts by Tanker and Barge from East Coast (PADD 1) of Total Petroleum Products (Thousand Barrels) | ||||||||
| Decade | Year-0 | Year-1 | Year-2 | Year-3 | Year-4 | Year-5 | Year-6 | Year-7 | Year-8 | Year-9 |
|---|---|---|---|---|---|---|---|---|---|---|
| 1980's | 23,747 | 25,583 | 26,790 | 32,480 | 30,834 | 877 | 1,194 | 1,607 | 1,757 | |
| 1990's | 1,477 | 1,076 | 1,310 | 1,373 | 755 | 444 | 418 | 1,326 | 1,378 | 1,829 |
| 2000's | 2,518 | 1,856 | 1,776 | 1,938 | 2,045 | 2,100 | 2,306 | 1,989 | 1,518 | 1,207 |
| 2010's | 1,328 | 1,925 | 1,408 | 1,702 | 1,218 | 1,666 | 1,137 | 1,089 | 445 | 450 |
| 2020's | 1,387 | 1,777 | 480 | 615 |
| - = No Data Reported; -- = Not Applicable; NA = Not Available; W = Withheld to avoid disclosure of individual company data. |
| Release Date: 3/29/2024 |
| Next Release Date: 8/30/2024 |