|
Download Data (XLS File) |
|
||||||||
|
||||||||
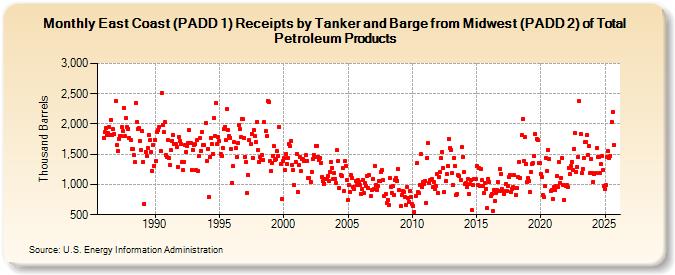
| East Coast (PADD 1) Receipts by Tanker and Barge from Midwest (PADD 2) of Total Petroleum Products (Thousand Barrels) | ||||||||
| Year | Jan | Feb | Mar | Apr | May | Jun | Jul | Aug | Sep | Oct | Nov | Dec |
|---|---|---|---|---|---|---|---|---|---|---|---|---|
| 1986 | 1,776 | 1,863 | 1,927 | 1,814 | 1,845 | 1,952 | 1,817 | 2,072 | 1,821 | 1,909 | 1,840 | 2,383 |
| 1987 | 1,645 | 1,545 | 1,757 | 1,804 | 1,798 | 1,944 | 1,876 | 2,257 | 1,793 | 2,096 | 1,942 | 1,923 |
| 1988 | 1,775 | 1,730 | 1,584 | 1,586 | 1,479 | 1,364 | 2,341 | 2,031 | 1,915 | 1,937 | 1,719 | 1,564 |
| 1989 | 1,876 | 1,373 | 684 | 1,543 | 1,471 | 1,610 | 1,820 | 1,727 | 1,530 | 1,226 | 1,658 | 1,306 |
| 1990 | 1,743 | 1,386 | 1,864 | 1,893 | 1,956 | 1,549 | 2,511 | 1,986 | 1,863 | 2,031 | 1,493 | 1,462 |
| 1991 | 1,728 | 1,435 | 1,322 | 1,565 | 1,725 | 1,821 | 1,665 | 1,662 | 1,620 | 1,296 | 1,792 | 1,719 |
| 1992 | 1,667 | 1,368 | 1,236 | 1,377 | 1,645 | 1,542 | 1,632 | 1,681 | 1,894 | 1,681 | 1,243 | 1,573 |
| 1993 | 1,647 | 1,662 | 1,241 | 1,729 | 1,229 | 1,472 | 1,771 | 1,561 | 1,863 | 1,650 | 1,647 | 2,015 |
| 1994 | 1,389 | 1,583 | 793 | 1,459 | 1,773 | 1,664 | 1,511 | 2,098 | 1,804 | 2,340 | 1,661 | 1,787 |
| 1995 | 1,717 | 1,500 | 1,467 | 1,608 | 1,911 | 1,955 | 1,731 | 2,244 | 1,904 | 1,800 | 1,773 | 1,584 |
| 1996 | 1,026 | 1,299 | 1,696 | 1,600 | 1,450 | 1,685 | 1,980 | 1,915 | 1,784 | 2,090 | 2,076 | 1,776 |
| 1997 | 1,459 | 1,368 | 855 | 1,151 | 1,729 | 1,667 | 1,841 | 1,445 | 1,896 | 1,807 | 1,702 | 2,039 |
| 1998 | 1,568 | 1,369 | 1,454 | 1,399 | 1,489 | 1,411 | 2,026 | 1,878 | 1,796 | 2,382 | 2,369 | 1,387 |
| 1999 | 1,219 | 1,357 | 1,477 | 1,630 | 1,397 | 1,414 | 1,555 | 1,471 | 1,950 | 1,332 | 758 | 1,380 |
| 2000 | 1,433 | 1,241 | 1,511 | 1,339 | 1,440 | 1,676 | 1,631 | 1,716 | 1,328 | 1,239 | 990 | 1,376 |
| 2001 | 1,510 | 882 | 1,322 | 1,456 | 1,220 | 1,422 | 1,415 | 1,381 | 1,381 | 1,480 | 1,393 | 1,112 |
| 2002 | 1,103 | 1,046 | 1,207 | 1,420 | 1,488 | 1,453 | 1,640 | 1,640 | 1,455 | 1,410 | 1,440 | 1,363 |
| 2003 | 1,119 | 1,062 | 1,016 | 1,086 | 1,086 | 1,137 | 1,061 | 1,209 | 1,374 | 1,275 | 1,092 | 1,191 |
| 2004 | 1,096 | 1,019 | 1,565 | 1,389 | 942 | 1,164 | 1,136 | 1,270 | 889 | 1,381 | 1,310 | 1,077 |
| 2005 | 747 | 986 | 876 | 1,155 | 1,106 | 962 | 926 | 1,065 | 994 | 1,067 | 1,045 | 986 |
| 2006 | 847 | 924 | 1,082 | 852 | 1,025 | 968 | 1,136 | 935 | 1,151 | 804 | 904 | 1,093 |
| 2007 | 922 | 1,312 | 997 | 910 | 971 | 1,051 | 1,051 | 1,210 | 1,234 | 1,070 | 809 | 842 |
| 2008 | 696 | 748 | 660 | 1,111 | 964 | 861 | 968 | 826 | 1,073 | 1,115 | 1,065 | 1,255 |
| 2009 | 901 | 638 | 823 | 896 | 871 | 790 | 666 | 956 | 778 | 717 | 887 | 798 |
| 2010 | 672 | 638 | 550 | 816 | 1,348 | 870 | 851 | 991 | 1,498 | 954 | 1,039 | 1,009 |
| 2011 | 1,065 | 701 | 1,441 | 1,679 | 1,019 | 1,078 | 1,086 | 951 | 1,042 | 917 | 976 | 1,165 |
| 2012 | 855 | 1,120 | 1,203 | 1,436 | 1,540 | 1,278 | 874 | 1,054 | 1,173 | 1,310 | 1,759 | 1,602 |
| 2013 | 1,576 | 1,182 | 993 | 1,444 | 1,309 | 818 | 843 | 1,151 | 1,141 | 1,082 | 1,612 | 1,451 |
| 2014 | 1,206 | 1,014 | 1,032 | 962 | 1,097 | 842 | 1,003 | 1,078 | 572 | 990 | 1,089 | 1,086 |
| 2015 | 1,312 | 995 | 1,277 | 971 | 1,262 | 1,067 | 978 | 851 | 1,029 | 930 | 605 | 1,087 |
| 2016 | 1,044 | 806 | 846 | 561 | 916 | 723 | 859 | 904 | 1,038 | 886 | 1,263 | 1,167 |
| 2017 | 920 | 891 | 840 | 1,009 | 898 | 973 | 1,120 | 1,160 | 880 | 931 | 958 | 1,154 |
| 2018 | 942 | 822 | 944 | 1,120 | 1,377 | 1,104 | 1,811 | 2,081 | 1,387 | 1,790 | 1,344 | 1,036 |
| 2019 | 1,102 | 1,061 | 877 | 1,205 | 1,344 | 1,350 | 1,470 | 1,832 | 1,748 | 1,734 | 1,350 | 1,348 |
| 2020 | 1,174 | 1,117 | 820 | 788 | 974 | 1,442 | 1,226 | 1,577 | 1,429 | 887 | 910 | 766 |
| 2021 | 958 | 903 | 967 | 1,133 | 960 | 1,371 | 1,030 | 1,113 | 1,436 | 998 | 750 | 981 |
| 2022 | 990 | 966 | 1,275 | 1,165 | 1,306 | 1,377 | 1,246 | 1,587 | 1,843 | 1,212 | 1,290 | 1,457 |
| 2023 | 2,374 | 1,832 | 1,185 | 1,252 | 1,438 | 1,696 | 1,710 | 1,824 | 1,490 | 1,636 | 1,193 | 1,421 |
| 2024 | 1,191 | |||||||||||
| - = No Data Reported; -- = Not Applicable; NA = Not Available; W = Withheld to avoid disclosure of individual company data. |
| Release Date: 3/29/2024 |
| Next Release Date: 4/30/2024 |