|
Download Data (XLS File) |
|
||||||||
|
||||||||
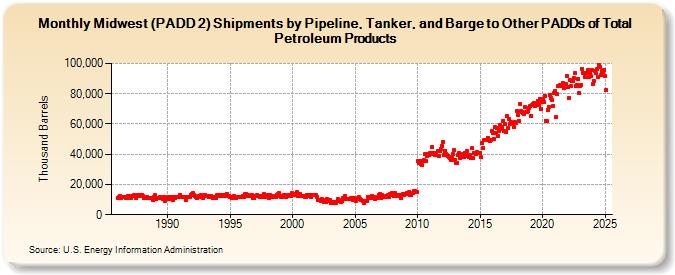
| Midwest (PADD 2) Shipments by Pipeline, Tanker, and Barge to Other PADDs of Total Petroleum Products (Thousand Barrels) | ||||||||
| Year | Jan | Feb | Mar | Apr | May | Jun | Jul | Aug | Sep | Oct | Nov | Dec |
|---|---|---|---|---|---|---|---|---|---|---|---|---|
| 1986 | 11,150 | 11,562 | 12,546 | 10,862 | 11,447 | 11,545 | 11,393 | 11,868 | 10,947 | 10,908 | 12,180 | 12,254 |
| 1987 | 12,278 | 11,225 | 12,369 | 12,460 | 12,877 | 12,503 | 11,000 | 13,222 | 12,283 | 12,709 | 12,780 | 13,304 |
| 1988 | 12,257 | 10,942 | 10,863 | 10,966 | 11,820 | 10,769 | 10,900 | 11,281 | 10,882 | 11,031 | 9,822 | 11,982 |
| 1989 | 12,862 | 10,317 | 11,022 | 11,150 | 11,229 | 11,578 | 10,948 | 10,612 | 11,562 | 9,204 | 10,390 | 10,131 |
| 1990 | 11,635 | 10,617 | 11,640 | 10,719 | 11,389 | 9,596 | 11,596 | 10,857 | 11,855 | 11,920 | 11,933 | 11,546 |
| 1991 | 13,063 | 11,489 | 11,425 | 11,578 | 11,526 | 11,897 | 9,989 | 12,042 | 11,789 | 11,853 | 13,121 | 13,908 |
| 1992 | 14,090 | 12,770 | 12,528 | 11,795 | 11,029 | 11,789 | 12,418 | 12,113 | 12,836 | 11,970 | 11,194 | 12,380 |
| 1993 | 13,358 | 12,186 | 12,552 | 12,436 | 11,580 | 11,681 | 12,297 | 10,899 | 11,790 | 11,957 | 11,210 | 12,713 |
| 1994 | 13,129 | 12,462 | 12,716 | 12,068 | 12,112 | 12,787 | 12,097 | 12,086 | 12,958 | 13,574 | 12,536 | 12,537 |
| 1995 | 11,600 | 11,451 | 11,377 | 11,378 | 12,089 | 11,658 | 10,745 | 11,860 | 11,422 | 11,913 | 11,769 | 11,727 |
| 1996 | 12,378 | 11,384 | 13,411 | 13,802 | 12,317 | 13,151 | 12,167 | 12,394 | 12,383 | 12,718 | 11,114 | 10,869 |
| 1997 | 12,426 | 12,136 | 12,820 | 12,502 | 12,660 | 11,725 | 12,076 | 11,946 | 13,483 | 12,041 | 12,064 | 12,265 |
| 1998 | 13,141 | 11,282 | 12,814 | 11,767 | 11,391 | 12,050 | 11,519 | 11,729 | 11,756 | 13,235 | 13,854 | 14,142 |
| 1999 | 12,101 | 11,615 | 11,859 | 12,684 | 12,920 | 13,282 | 11,772 | 12,174 | 13,092 | 12,669 | 12,341 | 14,337 |
| 2000 | 13,583 | 12,847 | 13,396 | 13,746 | 14,766 | 12,448 | 12,753 | 13,687 | 12,247 | 12,575 | 12,525 | 12,588 |
| 2001 | 11,775 | 11,425 | 12,992 | 12,566 | 12,714 | 12,944 | 11,832 | 13,159 | 12,899 | 12,818 | 12,891 | 11,787 |
| 2002 | 10,008 | 9,425 | 9,604 | 9,308 | 10,500 | 9,529 | 8,362 | 9,149 | 8,342 | 10,346 | 9,202 | 9,298 |
| 2003 | 9,420 | 7,535 | 8,480 | 8,584 | 7,548 | 8,347 | 7,907 | 10,188 | 9,501 | 8,852 | 8,201 | 9,226 |
| 2004 | 10,742 | 10,591 | 12,232 | 10,094 | 10,291 | 10,682 | 10,315 | 10,135 | 11,007 | 11,325 | 9,798 | 10,726 |
| 2005 | 9,722 | 9,259 | 10,691 | 10,783 | 11,411 | 10,231 | 10,060 | 9,120 | 8,055 | 9,126 | 8,999 | 9,227 |
| 2006 | 11,873 | 11,753 | 11,316 | 11,895 | 12,106 | 10,901 | 11,587 | 10,259 | 11,281 | 11,256 | 11,575 | 13,301 |
| 2007 | 13,542 | 11,037 | 13,006 | 11,522 | 11,806 | 12,000 | 12,099 | 12,775 | 12,013 | 13,398 | 13,096 | 14,226 |
| 2008 | 14,273 | 12,179 | 14,125 | 12,637 | 12,970 | 12,516 | 12,614 | 12,994 | 11,271 | 13,270 | 13,572 | 13,029 |
| 2009 | 13,580 | 13,368 | 14,407 | 13,827 | 15,052 | 13,317 | 13,186 | 14,041 | 15,428 | 15,450 | 14,726 | 15,123 |
| 2010 | 35,424 | 34,378 | 35,488 | 33,448 | 33,194 | 35,549 | 36,335 | 39,839 | 35,304 | 38,892 | 39,895 | 39,408 |
| 2011 | 41,051 | 39,879 | 44,887 | 40,937 | 41,079 | 39,431 | 39,367 | 41,976 | 39,090 | 41,807 | 43,380 | 45,280 |
| 2012 | 48,271 | 39,739 | 42,316 | 40,058 | 39,624 | 39,130 | 38,386 | 37,540 | 35,941 | 37,758 | 39,848 | 42,524 |
| 2013 | 36,260 | 34,176 | 34,071 | 39,585 | 40,519 | 37,474 | 38,166 | 39,947 | 38,150 | 40,874 | 40,138 | 41,901 |
| 2014 | 38,729 | 37,863 | 39,783 | 37,656 | 43,863 | 37,266 | 41,006 | 41,008 | 39,845 | 41,214 | 40,509 | 40,517 |
| 2015 | 40,898 | 37,992 | 47,144 | 43,845 | 49,145 | 49,077 | 49,631 | 50,959 | 49,139 | 48,883 | 49,229 | 55,474 |
| 2016 | 54,050 | 50,393 | 57,821 | 54,269 | 57,069 | 52,201 | 55,226 | 59,122 | 56,827 | 58,158 | 62,190 | 55,659 |
| 2017 | 59,654 | 55,011 | 65,027 | 57,554 | 63,308 | 60,135 | 61,160 | 60,861 | 58,232 | 61,178 | 60,580 | 68,519 |
| 2018 | 65,995 | 61,997 | 73,100 | 68,570 | 67,605 | 67,423 | 66,402 | 71,197 | 67,947 | 68,049 | 68,519 | 70,745 |
| 2019 | 72,202 | 65,548 | 72,620 | 73,437 | 74,091 | 72,068 | 72,256 | 75,283 | 72,287 | 76,612 | 70,137 | 74,841 |
| 2020 | 76,309 | 74,290 | 78,764 | 62,294 | 61,704 | 69,160 | 71,463 | 79,013 | 77,058 | 75,727 | 71,887 | 80,210 |
| 2021 | 81,729 | 64,325 | 79,499 | 85,115 | 85,085 | 85,667 | 85,060 | 86,820 | 83,565 | 86,434 | 86,381 | 91,973 |
| 2022 | 84,308 | 77,126 | 89,350 | 84,829 | 88,187 | 88,541 | 90,371 | 93,736 | 84,836 | 85,847 | 89,927 | 80,803 |
| 2023 | 85,063 | 86,002 | 94,546 | 93,022 | 93,596 | 90,884 | 93,311 | 95,479 | 92,026 | 94,555 | 91,777 | 94,168 |
| 2024 | 85,475 | |||||||||||
| - = No Data Reported; -- = Not Applicable; NA = Not Available; W = Withheld to avoid disclosure of individual company data. |
| Release Date: 3/29/2024 |
| Next Release Date: 4/30/2024 |