|
Download Data (XLS File) |
|
||||||||
|
||||||||
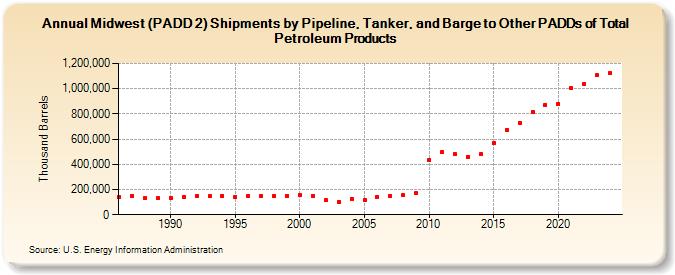
| Midwest (PADD 2) Shipments by Pipeline, Tanker, and Barge to Other PADDs of Total Petroleum Products (Thousand Barrels) | ||||||||
| Decade | Year-0 | Year-1 | Year-2 | Year-3 | Year-4 | Year-5 | Year-6 | Year-7 | Year-8 | Year-9 |
|---|---|---|---|---|---|---|---|---|---|---|
| 1980's | 138,662 | 149,010 | 133,515 | 131,005 | ||||||
| 1990's | 135,303 | 143,680 | 146,912 | 144,659 | 151,062 | 138,989 | 148,088 | 148,144 | 148,680 | 150,846 |
| 2000's | 157,161 | 149,802 | 113,073 | 103,789 | 127,938 | 116,684 | 139,103 | 150,520 | 155,450 | 171,505 |
| 2010's | 437,155 | 498,164 | 481,135 | 461,260 | 479,258 | 571,415 | 672,987 | 731,220 | 817,548 | 871,380 |
| 2020's | 877,878 | 1,001,652 | 1,037,862 | 1,104,427 |
| - = No Data Reported; -- = Not Applicable; NA = Not Available; W = Withheld to avoid disclosure of individual company data. |
| Release Date: 3/29/2024 |
| Next Release Date: 8/30/2024 |