|
Download Data (XLS File) |
|
||||||||
|
||||||||
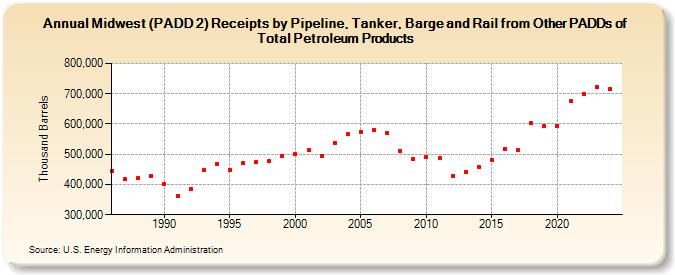
| Midwest (PADD 2) Receipts by Pipeline, Tanker, Barge and Rail from Other PADDs of Total Petroleum Products (Thousand Barrels) | ||||||||
| Decade | Year-0 | Year-1 | Year-2 | Year-3 | Year-4 | Year-5 | Year-6 | Year-7 | Year-8 | Year-9 |
|---|---|---|---|---|---|---|---|---|---|---|
| 1980's | 446,152 | 417,560 | 420,939 | 429,287 | ||||||
| 1990's | 402,629 | 361,368 | 386,206 | 448,510 | 466,248 | 448,671 | 469,568 | 474,455 | 476,325 | 495,157 |
| 2000's | 500,228 | 513,065 | 494,711 | 537,139 | 565,231 | 573,221 | 580,140 | 569,256 | 509,359 | 485,284 |
| 2010's | 491,919 | 486,118 | 428,746 | 441,420 | 457,807 | 481,382 | 517,852 | 512,912 | 604,431 | 591,940 |
| 2020's | 594,387 | 676,016 | 698,242 | 721,933 |
| - = No Data Reported; -- = Not Applicable; NA = Not Available; W = Withheld to avoid disclosure of individual company data. |
| Release Date: 3/29/2024 |
| Next Release Date: 8/30/2024 |