|
Download Data (XLS File) |
|
||||||||
|
||||||||
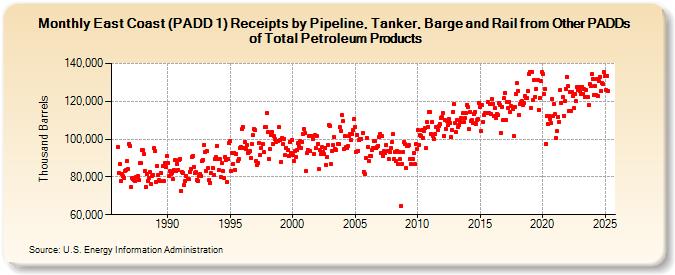
| East Coast (PADD 1) Receipts by Pipeline, Tanker, Barge and Rail from Other PADDs of Total Petroleum Products (Thousand Barrels) | ||||||||
| Year | Jan | Feb | Mar | Apr | May | Jun | Jul | Aug | Sep | Oct | Nov | Dec |
|---|---|---|---|---|---|---|---|---|---|---|---|---|
| 1986 | 95,927 | 81,965 | 86,581 | 77,777 | 81,715 | 80,258 | 79,554 | 83,325 | 83,779 | 88,519 | 84,267 | 97,639 |
| 1987 | 96,307 | 74,877 | 79,487 | 78,707 | 78,205 | 77,749 | 80,163 | 80,306 | 78,402 | 87,265 | 87,560 | 94,025 |
| 1988 | 94,058 | 92,187 | 83,020 | 74,787 | 81,284 | 77,860 | 79,492 | 82,372 | 76,145 | 80,722 | 81,180 | 95,108 |
| 1989 | 93,666 | 77,475 | 85,520 | 81,247 | 78,262 | 77,670 | 81,933 | 85,607 | 77,776 | 87,392 | 85,112 | 91,026 |
| 1990 | 87,599 | 80,389 | 83,052 | 81,336 | 82,252 | 78,678 | 83,799 | 88,879 | 82,923 | 86,994 | 83,793 | 89,051 |
| 1991 | 89,489 | 72,686 | 82,434 | 81,865 | 75,623 | 77,935 | 80,291 | 78,901 | 78,954 | 82,775 | 84,257 | 90,571 |
| 1992 | 91,115 | 85,454 | 82,214 | 82,458 | 78,573 | 78,050 | 80,479 | 81,309 | 80,688 | 88,470 | 88,952 | 97,023 |
| 1993 | 93,053 | 83,333 | 93,463 | 84,772 | 78,433 | 76,986 | 81,874 | 84,963 | 81,095 | 89,352 | 90,398 | 96,560 |
| 1994 | 89,208 | 83,483 | 89,228 | 79,897 | 87,203 | 82,940 | 79,654 | 90,538 | 88,969 | 77,174 | 89,370 | 98,177 |
| 1995 | 99,097 | 83,026 | 92,526 | 86,954 | 92,682 | 83,708 | 92,219 | 88,479 | 89,725 | 95,158 | 95,931 | 105,082 |
| 1996 | 106,580 | 95,346 | 98,247 | 94,960 | 96,856 | 92,791 | 93,071 | 93,602 | 90,125 | 97,367 | 101,984 | 105,291 |
| 1997 | 104,798 | 88,502 | 86,542 | 87,384 | 97,768 | 91,575 | 95,471 | 97,545 | 92,958 | 106,306 | 106,196 | 113,638 |
| 1998 | 103,659 | 89,650 | 94,517 | 102,145 | 103,900 | 97,224 | 101,516 | 100,010 | 98,353 | 99,011 | 99,199 | 106,372 |
| 1999 | 99,771 | 87,895 | 100,710 | 97,339 | 100,316 | 91,455 | 95,426 | 94,444 | 91,003 | 98,552 | 92,874 | 99,296 |
| 2000 | 91,457 | 88,420 | 93,519 | 90,785 | 94,338 | 97,833 | 96,085 | 98,998 | 95,466 | 98,489 | 102,605 | 105,270 |
| 2001 | 103,037 | 83,168 | 92,579 | 94,246 | 101,866 | 93,698 | 101,701 | 99,988 | 92,123 | 101,938 | 95,086 | 101,411 |
| 2002 | 97,564 | 83,976 | 94,140 | 92,079 | 95,679 | 93,267 | 91,883 | 95,099 | 86,480 | 90,463 | 96,849 | 107,557 |
| 2003 | 107,083 | 86,630 | 93,617 | 97,123 | 100,978 | 94,670 | 94,451 | 97,575 | 97,504 | 106,208 | 104,518 | 112,845 |
| 2004 | 109,325 | 94,642 | 101,407 | 95,681 | 95,109 | 96,111 | 101,862 | 102,874 | 99,547 | 102,688 | 104,894 | 110,486 |
| 2005 | 106,597 | 93,117 | 102,162 | 93,843 | 99,295 | 99,874 | 100,103 | 103,352 | 82,845 | 81,622 | 90,056 | 100,745 |
| 2006 | 95,940 | 88,366 | 90,939 | 91,072 | 94,485 | 95,267 | 98,764 | 99,119 | 95,248 | 95,895 | 96,456 | 101,132 |
| 2007 | 102,707 | 92,910 | 101,468 | 91,290 | 93,453 | 92,797 | 96,628 | 93,677 | 89,543 | 93,367 | 95,300 | 98,297 |
| 2008 | 102,617 | 89,309 | 93,249 | 88,594 | 93,850 | 87,038 | 93,219 | 89,245 | 64,659 | 86,854 | 93,360 | 98,446 |
| 2009 | 97,509 | 84,508 | 96,421 | 96,426 | 96,687 | 89,702 | 86,648 | 89,414 | 92,632 | 86,639 | 97,218 | 94,844 |
| 2010 | 104,568 | 96,997 | 102,044 | 101,632 | 104,675 | 100,823 | 104,319 | 105,846 | 95,096 | 108,785 | 106,543 | 114,275 |
| 2011 | 114,190 | 102,815 | 108,988 | 101,460 | 100,024 | 102,567 | 106,484 | 104,714 | 106,693 | 107,947 | 111,165 | 111,567 |
| 2012 | 113,864 | 101,508 | 110,098 | 105,298 | 109,461 | 107,237 | 110,878 | 108,496 | 100,890 | 104,838 | 114,487 | 118,314 |
| 2013 | 108,627 | 103,595 | 109,984 | 106,328 | 107,444 | 109,174 | 110,952 | 113,594 | 108,844 | 111,265 | 113,716 | 118,058 |
| 2014 | 116,879 | 105,109 | 114,481 | 109,681 | 110,123 | 108,651 | 113,168 | 114,495 | 108,129 | 110,081 | 110,391 | 118,984 |
| 2015 | 117,009 | 104,026 | 118,001 | 108,939 | 112,937 | 113,963 | 113,766 | 119,647 | 113,568 | 118,454 | 113,504 | 121,082 |
| 2016 | 118,431 | 112,077 | 116,395 | 111,283 | 113,353 | 112,650 | 118,870 | 118,001 | 103,409 | 117,218 | 110,118 | 121,601 |
| 2017 | 124,589 | 110,002 | 119,659 | 116,338 | 119,746 | 114,503 | 117,487 | 116,044 | 101,679 | 116,874 | 123,948 | 129,413 |
| 2018 | 125,356 | 112,615 | 118,560 | 119,589 | 120,217 | 117,808 | 119,204 | 122,751 | 121,661 | 121,795 | 125,412 | 134,541 |
| 2019 | 135,680 | 116,279 | 135,550 | 120,938 | 131,288 | 122,379 | 126,713 | 131,327 | 115,496 | 121,557 | 130,574 | 135,242 |
| 2020 | 134,254 | 123,728 | 126,652 | 97,587 | 112,259 | 108,102 | 112,007 | 110,777 | 108,269 | 121,260 | 112,197 | 118,534 |
| 2021 | 113,044 | 100,427 | 104,167 | 111,917 | 109,182 | 125,936 | 119,268 | 122,184 | 112,404 | 119,985 | 126,641 | 132,902 |
| 2022 | 127,857 | 114,799 | 124,998 | 115,007 | 125,162 | 122,658 | 116,398 | 123,970 | 120,147 | 127,461 | 126,000 | 127,443 |
| 2023 | 125,368 | 123,778 | 127,535 | 123,911 | 126,308 | 122,474 | 125,957 | 122,239 | 118,076 | 128,894 | 127,960 | 134,344 |
| 2024 | 131,943 | 123,142 | 128,100 | 123,384 | 131,226 | 122,639 | ||||||
| - = No Data Reported; -- = Not Applicable; NA = Not Available; W = Withheld to avoid disclosure of individual company data. |
| Release Date: 8/30/2024 |
| Next Release Date: 9/30/2024 |