|
Download Data (XLS File) |
|
||||||||
|
||||||||
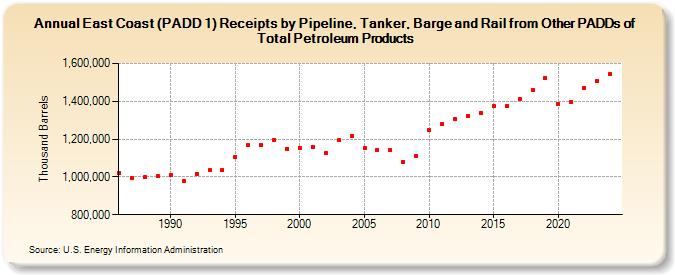
| East Coast (PADD 1) Receipts by Pipeline, Tanker, Barge and Rail from Other PADDs of Total Petroleum Products (Thousand Barrels) | ||||||||
| Decade | Year-0 | Year-1 | Year-2 | Year-3 | Year-4 | Year-5 | Year-6 | Year-7 | Year-8 | Year-9 |
|---|---|---|---|---|---|---|---|---|---|---|
| 1980's | 1,021,306 | 993,053 | 998,215 | 1,002,686 | ||||||
| 1990's | 1,008,745 | 975,781 | 1,014,785 | 1,034,282 | 1,035,841 | 1,104,587 | 1,166,220 | 1,168,683 | 1,195,556 | 1,149,081 |
| 2000's | 1,153,265 | 1,160,841 | 1,125,036 | 1,193,202 | 1,214,626 | 1,153,611 | 1,142,683 | 1,141,437 | 1,080,440 | 1,108,648 |
| 2010's | 1,245,604 | 1,278,616 | 1,305,368 | 1,321,581 | 1,340,172 | 1,374,897 | 1,373,406 | 1,410,281 | 1,459,509 | 1,523,024 |
| 2020's | 1,385,625 | 1,398,057 | 1,471,900 | 1,506,844 |
| - = No Data Reported; -- = Not Applicable; NA = Not Available; W = Withheld to avoid disclosure of individual company data. |
| Release Date: 8/30/2024 |
| Next Release Date: 8/29/2025 |