|
Download Data (XLS File) |
|
||||||||
|
||||||||
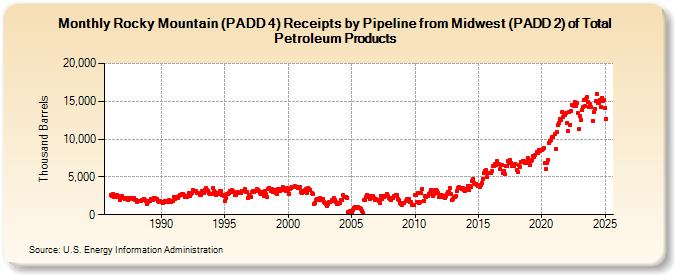
| Rocky Mountain (PADD 4) Receipts by Pipeline from Midwest (PADD 2) of Total Petroleum Products (Thousand Barrels) | ||||||||
| Year | Jan | Feb | Mar | Apr | May | Jun | Jul | Aug | Sep | Oct | Nov | Dec |
|---|---|---|---|---|---|---|---|---|---|---|---|---|
| 1986 | 2,600 | 2,513 | 2,785 | 2,325 | 2,292 | 2,358 | 2,617 | 2,463 | 2,370 | 1,934 | 2,251 | 2,467 |
| 1987 | 2,244 | 2,070 | 2,058 | 2,244 | 1,985 | 2,108 | 2,217 | 2,264 | 2,237 | 2,077 | 2,242 | 1,880 |
| 1988 | 2,009 | 1,682 | 1,851 | 1,767 | 1,748 | 1,765 | 1,915 | 2,144 | 1,974 | 1,794 | 1,449 | 1,627 |
| 1989 | 1,838 | 1,835 | 2,030 | 1,967 | 1,933 | 2,179 | 2,172 | 2,090 | 2,023 | 1,794 | 1,627 | 1,870 |
| 1990 | 1,644 | 1,517 | 1,744 | 1,816 | 1,777 | 1,802 | 1,726 | 1,891 | 1,642 | 1,692 | 1,879 | 1,803 |
| 1991 | 2,378 | 2,071 | 2,305 | 2,214 | 2,224 | 2,486 | 2,610 | 2,743 | 2,685 | 2,588 | 2,373 | 2,445 |
| 1992 | 2,398 | 2,500 | 2,913 | 2,409 | 2,745 | 2,930 | 3,243 | 3,171 | 3,177 | 3,188 | 2,925 | 2,858 |
| 1993 | 2,603 | 2,653 | 3,131 | 3,160 | 2,891 | 3,305 | 3,483 | 3,273 | 3,183 | 2,883 | 2,791 | 2,794 |
| 1994 | 2,797 | 3,553 | 3,169 | 2,970 | 2,642 | 2,933 | 2,676 | 3,110 | 3,135 | 2,587 | 2,551 | 2,523 |
| 1995 | 1,776 | 2,233 | 2,784 | 2,676 | 2,936 | 3,099 | 3,030 | 3,245 | 3,084 | 2,949 | 2,589 | 2,594 |
| 1996 | 2,993 | 2,810 | 2,822 | 2,897 | 3,199 | 3,073 | 3,072 | 3,335 | 2,984 | 3,032 | 2,271 | 2,593 |
| 1997 | 2,469 | 2,407 | 2,980 | 3,187 | 3,019 | 3,192 | 3,376 | 3,218 | 3,138 | 2,910 | 2,802 | 2,960 |
| 1998 | 2,885 | 2,421 | 3,179 | 2,693 | 2,294 | 3,452 | 3,573 | 3,346 | 3,194 | 3,430 | 3,032 | 3,236 |
| 1999 | 2,890 | 2,763 | 3,336 | 3,357 | 3,196 | 3,331 | 3,367 | 3,618 | 3,290 | 3,384 | 3,182 | 3,484 |
| 2000 | 3,259 | 2,753 | 3,439 | 3,510 | 3,689 | 3,657 | 3,761 | 3,638 | 3,710 | 3,530 | 3,559 | 3,690 |
| 2001 | 2,964 | 2,806 | 3,102 | 2,964 | 3,261 | 3,363 | 2,910 | 3,514 | 3,373 | 3,323 | 2,859 | 2,743 |
| 2002 | 1,438 | 1,547 | 1,918 | 2,038 | 2,131 | 2,003 | 2,158 | 2,086 | 2,002 | 2,095 | 1,687 | 1,530 |
| 2003 | 1,473 | 1,202 | 1,351 | 1,634 | 1,652 | 1,892 | 1,863 | 2,173 | 1,974 | 1,684 | 1,416 | 1,351 |
| 2004 | 1,558 | 1,613 | 1,881 | 1,937 | 2,563 | 2,354 | 2,292 | 2,362 | 2,224 | 378 | 434 | 474 |
| 2005 | 328 | 654 | 907 | 1,068 | 1,075 | 948 | 974 | 848 | 908 | 818 | 504 | 165 |
| 2006 | 1,893 | 1,953 | 2,386 | 2,666 | 2,458 | 2,064 | 2,503 | 2,277 | 2,481 | 2,212 | 2,008 | 2,014 |
| 2007 | 1,948 | 1,896 | 1,766 | 1,518 | 2,442 | 2,039 | 2,417 | 2,360 | 2,416 | 2,790 | 2,480 | 2,194 |
| 2008 | 2,032 | 1,884 | 2,164 | 2,177 | 2,470 | 2,495 | 2,605 | 2,603 | 2,112 | 1,895 | 1,575 | 1,453 |
| 2009 | 1,317 | 1,573 | 1,538 | 1,765 | 2,028 | 1,903 | 2,082 | 1,711 | 1,691 | 1,267 | 1,311 | 1,239 |
| 2010 | 2,584 | 2,587 | 1,669 | 2,814 | 1,511 | 1,697 | 2,816 | 3,463 | 1,876 | 2,414 | 2,332 | 2,444 |
| 2011 | 2,457 | 2,768 | 2,809 | 3,272 | 3,230 | 2,459 | 2,724 | 2,812 | 3,285 | 3,202 | 2,935 | 2,323 |
| 2012 | 2,569 | 2,284 | 2,568 | 2,494 | 2,269 | 2,520 | 2,702 | 2,957 | 2,943 | 3,484 | 2,680 | 1,899 |
| 2013 | 2,098 | 2,363 | 2,286 | 2,515 | 3,166 | 3,565 | 3,628 | 3,527 | 3,388 | 3,555 | 3,285 | 3,107 |
| 2014 | 3,419 | 3,243 | 3,807 | 3,215 | 3,778 | 3,643 | 4,431 | 4,780 | 4,249 | 4,085 | 4,105 | 3,869 |
| 2015 | 3,811 | 3,701 | 3,966 | 4,180 | 4,694 | 5,520 | 5,790 | 5,907 | 4,926 | 5,523 | 5,455 | 5,511 |
| 2016 | 5,524 | 5,745 | 6,469 | 6,396 | 6,647 | 6,585 | 7,040 | 6,654 | 6,036 | 6,525 | 6,519 | 5,503 |
| 2017 | 5,720 | 5,357 | 6,405 | 6,408 | 7,046 | 6,784 | 7,257 | 6,904 | 6,377 | 6,441 | 6,379 | 6,654 |
| 2018 | 5,884 | 5,679 | 6,549 | 6,333 | 6,999 | 6,967 | 7,073 | 7,042 | 6,883 | 6,977 | 6,897 | 7,448 |
| 2019 | 7,145 | 6,516 | 7,160 | 7,263 | 7,748 | 7,584 | 7,880 | 8,326 | 8,096 | 8,530 | 8,361 | 8,569 |
| 2020 | 8,592 | 8,626 | 8,833 | 6,798 | 6,018 | 6,839 | 7,221 | 9,541 | 9,769 | 9,907 | 10,219 | 10,214 |
| 2021 | 10,631 | 8,744 | 10,943 | 11,854 | 12,163 | 12,654 | 12,585 | 13,557 | 12,916 | 13,258 | 13,236 | 13,459 |
| 2022 | 12,129 | 11,028 | 13,621 | 11,904 | 13,660 | 14,528 | 14,326 | 14,911 | 14,403 | 14,809 | 13,420 | 11,354 |
| 2023 | 13,010 | 12,531 | 13,899 | 14,276 | 15,155 | 14,438 | 15,351 | 15,511 | 14,905 | 14,243 | 14,605 | 14,180 |
| 2024 | 12,430 | |||||||||||
| - = No Data Reported; -- = Not Applicable; NA = Not Available; W = Withheld to avoid disclosure of individual company data. |
| Release Date: 3/29/2024 |
| Next Release Date: 4/30/2024 |