|
Download Data (XLS File) |
|
||||||||
|
||||||||
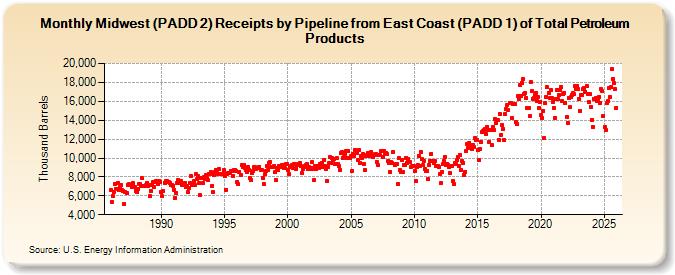
| Midwest (PADD 2) Receipts by Pipeline from East Coast (PADD 1) of Total Petroleum Products (Thousand Barrels) | ||||||||
| Year | Jan | Feb | Mar | Apr | May | Jun | Jul | Aug | Sep | Oct | Nov | Dec |
|---|---|---|---|---|---|---|---|---|---|---|---|---|
| 1986 | 6,592 | 5,379 | 5,988 | 6,392 | 7,237 | 6,747 | 6,672 | 7,388 | 6,575 | 6,950 | 7,092 | 6,590 |
| 1987 | 6,499 | 5,164 | 6,413 | 6,256 | 7,148 | 7,213 | 7,100 | 7,102 | 6,921 | 7,311 | 6,980 | 6,911 |
| 1988 | 6,493 | 6,371 | 6,769 | 7,205 | 7,203 | 7,022 | 7,841 | 7,068 | 6,999 | 7,095 | 7,359 | 7,070 |
| 1989 | 7,175 | 5,948 | 6,463 | 7,156 | 7,418 | 6,933 | 7,443 | 7,543 | 7,465 | 7,216 | 7,578 | 7,468 |
| 1990 | 6,378 | 5,952 | 6,501 | 7,390 | 7,574 | 7,520 | 7,438 | 7,470 | 7,331 | 7,093 | 7,173 | 7,073 |
| 1991 | 6,639 | 5,819 | 6,346 | 7,345 | 7,660 | 7,532 | 7,352 | 7,531 | 7,158 | 7,184 | 7,400 | 6,936 |
| 1992 | 7,063 | 6,426 | 6,833 | 7,401 | 8,076 | 7,125 | 7,232 | 7,539 | 7,155 | 8,277 | 7,747 | 8,122 |
| 1993 | 7,381 | 6,045 | 7,856 | 7,342 | 7,957 | 7,777 | 8,162 | 7,867 | 7,645 | 8,342 | 8,313 | 8,468 |
| 1994 | 7,077 | 6,380 | 8,252 | 8,565 | 8,754 | 8,417 | 8,314 | 8,804 | 8,334 | 8,272 | 8,297 | 8,692 |
| 1995 | 8,069 | 6,647 | 8,353 | 8,409 | 8,365 | 8,439 | 8,651 | 8,614 | 8,095 | 8,698 | 8,768 | 8,579 |
| 1996 | 7,511 | 7,208 | 8,539 | 8,234 | 9,207 | 9,069 | 9,244 | 8,912 | 8,730 | 8,566 | 9,078 | 8,722 |
| 1997 | 7,906 | 7,690 | 8,382 | 8,613 | 9,020 | 8,996 | 8,860 | 8,906 | 8,941 | 9,063 | 8,693 | 8,688 |
| 1998 | 7,922 | 7,239 | 8,258 | 8,624 | 9,192 | 8,728 | 9,466 | 9,586 | 9,021 | 9,074 | 9,036 | 9,194 |
| 1999 | 8,471 | 7,642 | 8,900 | 8,723 | 9,147 | 9,084 | 9,247 | 9,224 | 8,921 | 8,900 | 9,363 | 9,381 |
| 2000 | 8,741 | 8,268 | 9,060 | 9,169 | 9,237 | 8,937 | 9,376 | 9,385 | 8,873 | 9,300 | 9,392 | 9,438 |
| 2001 | 9,153 | 8,371 | 8,793 | 9,086 | 9,179 | 9,244 | 9,375 | 8,836 | 9,044 | 8,846 | 8,995 | 9,528 |
| 2002 | 8,790 | 7,687 | 9,182 | 8,836 | 9,120 | 8,982 | 9,386 | 9,157 | 9,517 | 9,067 | 9,778 | 9,203 |
| 2003 | 8,885 | 7,534 | 9,068 | 9,432 | 10,098 | 9,522 | 9,970 | 9,776 | 9,909 | 9,392 | 9,979 | 9,336 |
| 2004 | 9,179 | 8,727 | 10,571 | 10,618 | 9,992 | 10,086 | 10,447 | 10,701 | 10,047 | 10,770 | 10,041 | 10,008 |
| 2005 | 10,238 | 8,649 | 10,450 | 10,233 | 10,879 | 10,503 | 9,785 | 10,833 | 9,489 | 10,173 | 10,015 | 10,433 |
| 2006 | 9,413 | 8,707 | 10,160 | 10,268 | 10,553 | 10,197 | 10,327 | 10,657 | 10,389 | 10,086 | 10,369 | 10,412 |
| 2007 | 9,601 | 9,271 | 10,368 | 10,338 | 10,749 | 10,770 | 10,153 | 10,692 | 10,420 | 10,506 | 10,408 | 9,699 |
| 2008 | 9,485 | 8,560 | 9,553 | 9,478 | 10,615 | 9,307 | 9,316 | 9,407 | 7,297 | 9,959 | 8,728 | 8,563 |
| 2009 | 9,838 | 8,508 | 9,289 | 9,232 | 10,047 | 9,494 | 9,946 | 9,587 | 9,555 | 9,072 | 9,117 | 9,102 |
| 2010 | 8,653 | 7,567 | 9,100 | 9,248 | 10,215 | 9,149 | 10,650 | 9,851 | 9,209 | 9,735 | 8,835 | 8,647 |
| 2011 | 8,633 | 7,759 | 9,283 | 9,691 | 10,444 | 9,667 | 9,436 | 9,688 | 9,161 | 9,131 | 9,130 | 9,058 |
| 2012 | 8,332 | 7,319 | 8,538 | 9,386 | 9,676 | 10,066 | 9,214 | 9,411 | 9,311 | 9,046 | 8,387 | 9,141 |
| 2013 | 7,563 | 7,243 | 9,462 | 9,399 | 9,758 | 10,102 | 9,192 | 10,322 | 8,740 | 9,665 | 9,481 | 8,196 |
| 2014 | 8,522 | 10,734 | 11,515 | 11,060 | 11,627 | 11,126 | 10,976 | 11,419 | 11,142 | 12,064 | 11,860 | 11,884 |
| 2015 | 10,816 | 9,739 | 10,995 | 11,734 | 12,782 | 12,830 | 12,934 | 13,110 | 12,524 | 13,294 | 12,957 | 11,701 |
| 2016 | 13,013 | 11,380 | 13,294 | 12,987 | 14,142 | 13,726 | 13,972 | 13,972 | 11,931 | 14,645 | 12,474 | 13,517 |
| 2017 | 13,060 | 11,895 | 14,692 | 15,190 | 15,646 | 15,079 | 15,799 | 15,871 | 14,219 | 15,765 | 15,747 | 15,690 |
| 2018 | 13,799 | 13,601 | 16,532 | 16,254 | 17,759 | 16,579 | 17,945 | 18,325 | 16,755 | 16,917 | 16,361 | 15,247 |
| 2019 | 15,337 | 14,404 | 18,022 | 17,044 | 16,294 | 16,329 | 16,708 | 16,906 | 15,996 | 16,413 | 15,283 | 15,901 |
| 2020 | 14,562 | 14,211 | 15,008 | 12,118 | 15,772 | 16,464 | 17,464 | 16,888 | 16,332 | 17,168 | 16,299 | 15,977 |
| 2021 | 15,332 | 14,258 | 16,206 | 17,243 | 16,211 | 16,653 | 17,236 | 17,503 | 16,008 | 16,737 | 16,921 | 15,824 |
| 2022 | 14,325 | 13,712 | 16,371 | 15,363 | 16,436 | 16,693 | 16,866 | 16,734 | 17,607 | 17,337 | 17,622 | 17,266 |
| 2023 | 16,220 | 15,025 | 16,617 | 16,652 | 17,333 | 17,391 | 17,013 | 17,642 | 16,811 | 15,942 | 16,763 | 15,438 |
| 2024 | 13,817 | |||||||||||
| - = No Data Reported; -- = Not Applicable; NA = Not Available; W = Withheld to avoid disclosure of individual company data. |
| Release Date: 3/29/2024 |
| Next Release Date: 4/30/2024 |