|
Download Data (XLS File) |
|
||||||||
|
||||||||
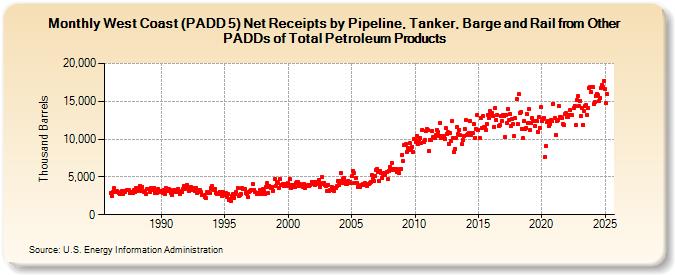
| West Coast (PADD 5) Net Receipts by Pipeline, Tanker, Barge and Rail from Other PADDs of Total Petroleum Products (Thousand Barrels) | ||||||||
| Year | Jan | Feb | Mar | Apr | May | Jun | Jul | Aug | Sep | Oct | Nov | Dec |
|---|---|---|---|---|---|---|---|---|---|---|---|---|
| 1986 | 2,916 | 2,484 | 3,013 | 3,491 | 2,973 | 3,168 | 3,084 | 2,948 | 2,850 | 2,710 | 2,701 | 3,079 |
| 1987 | 2,805 | 3,047 | 3,178 | 3,282 | 3,253 | 3,212 | 2,879 | 2,811 | 2,942 | 2,868 | 3,208 | 3,026 |
| 1988 | 3,513 | 3,080 | 3,512 | 3,257 | 3,838 | 3,194 | 3,660 | 2,977 | 3,196 | 2,725 | 3,339 | 3,381 |
| 1989 | 3,412 | 3,000 | 3,484 | 3,374 | 3,209 | 3,556 | 2,874 | 3,003 | 2,876 | 3,433 | 2,981 | 3,183 |
| 1990 | 3,107 | 2,896 | 3,282 | 2,745 | 3,519 | 3,225 | 3,120 | 3,361 | 3,249 | 2,863 | 2,636 | 3,150 |
| 1991 | 3,253 | 3,061 | 3,028 | 3,324 | 3,409 | 3,084 | 2,753 | 2,974 | 3,406 | 3,812 | 3,350 | 3,645 |
| 1992 | 3,989 | 3,709 | 3,179 | 3,555 | 3,656 | 3,277 | 3,520 | 3,522 | 3,077 | 3,565 | 2,856 | 3,229 |
| 1993 | 3,205 | 2,960 | 2,621 | 2,551 | 2,641 | 2,289 | 2,194 | 2,973 | 2,848 | 3,008 | 2,827 | 3,480 |
| 1994 | 3,775 | 3,381 | 3,303 | 3,426 | 2,870 | 2,726 | 2,733 | 3,043 | 3,002 | 2,518 | 3,064 | 2,621 |
| 1995 | 2,794 | 2,806 | 2,354 | 2,762 | 1,922 | 2,096 | 1,793 | 2,457 | 2,735 | 2,253 | 2,734 | 3,024 |
| 1996 | 3,478 | 2,411 | 2,559 | 2,800 | 3,559 | 3,463 | 3,451 | 3,362 | 2,866 | 2,802 | 2,280 | 3,044 |
| 1997 | 3,096 | 3,269 | 3,322 | 4,060 | 3,282 | 2,959 | 2,755 | 2,854 | 2,738 | 3,232 | 2,794 | 3,269 |
| 1998 | 3,368 | 3,119 | 2,758 | 3,646 | 4,158 | 2,842 | 3,851 | 3,615 | 3,485 | 3,679 | 3,192 | 4,675 |
| 1999 | 3,834 | 4,273 | 4,164 | 3,593 | 4,678 | 3,886 | 3,984 | 4,082 | 3,804 | 3,857 | 4,089 | 3,759 |
| 2000 | 4,190 | 3,887 | 4,664 | 3,500 | 3,888 | 3,910 | 3,618 | 4,257 | 4,388 | 4,271 | 3,771 | 4,004 |
| 2001 | 3,806 | 3,777 | 3,723 | 4,122 | 3,509 | 3,749 | 3,829 | 3,918 | 3,741 | 3,865 | 4,362 | 4,022 |
| 2002 | 4,323 | 3,930 | 4,354 | 4,094 | 4,004 | 4,598 | 3,687 | 4,086 | 4,961 | 4,234 | 4,234 | 3,885 |
| 2003 | 3,749 | 3,144 | 3,970 | 3,094 | 3,329 | 3,659 | 3,246 | 3,103 | 3,496 | 3,531 | 3,796 | 4,447 |
| 2004 | 3,919 | 4,400 | 5,577 | 4,143 | 4,657 | 4,905 | 4,366 | 4,036 | 4,063 | 4,504 | 4,330 | 4,236 |
| 2005 | 5,082 | 5,847 | 5,529 | 4,259 | 4,819 | 4,178 | 3,635 | 3,724 | 3,725 | 3,928 | 3,873 | 4,050 |
| 2006 | 4,023 | 4,160 | 3,958 | 3,749 | 4,111 | 4,198 | 4,329 | 5,189 | 4,752 | 4,461 | 5,117 | 5,896 |
| 2007 | 6,097 | 5,668 | 4,506 | 5,826 | 5,533 | 4,850 | 5,263 | 5,466 | 5,276 | 5,624 | 4,663 | 5,807 |
| 2008 | 6,329 | 5,887 | 6,886 | 6,037 | 5,857 | 5,987 | 6,063 | 5,677 | 5,867 | 5,547 | 6,042 | 6,034 |
| 2009 | 7,938 | 7,087 | 9,163 | 9,312 | 8,335 | 8,884 | 8,522 | 9,428 | 8,721 | 8,976 | 8,301 | 10,022 |
| 2010 | 10,057 | 9,649 | 10,397 | 9,371 | 9,873 | 10,129 | 9,518 | 11,242 | 9,621 | 9,831 | 11,051 | 11,366 |
| 2011 | 11,181 | 8,475 | 9,852 | 9,917 | 11,059 | 10,224 | 10,342 | 10,170 | 10,476 | 11,267 | 10,931 | 10,382 |
| 2012 | 12,176 | 10,117 | 10,411 | 10,383 | 9,997 | 11,411 | 10,663 | 10,893 | 9,397 | 10,834 | 9,743 | 12,394 |
| 2013 | 10,088 | 8,286 | 8,755 | 10,136 | 11,635 | 10,657 | 11,247 | 10,488 | 9,305 | 9,899 | 10,431 | 11,394 |
| 2014 | 12,482 | 10,518 | 10,727 | 10,872 | 12,419 | 10,500 | 10,810 | 10,805 | 11,975 | 10,204 | 11,372 | 13,166 |
| 2015 | 11,249 | 10,161 | 12,789 | 11,526 | 13,021 | 11,548 | 11,564 | 11,202 | 11,962 | 13,187 | 12,730 | 13,748 |
| 2016 | 13,353 | 13,515 | 13,082 | 11,601 | 14,144 | 12,547 | 13,223 | 11,764 | 11,814 | 13,050 | 12,451 | 13,229 |
| 2017 | 12,998 | 10,310 | 13,220 | 12,159 | 13,965 | 12,470 | 13,312 | 11,763 | 12,594 | 11,947 | 10,373 | 12,780 |
| 2018 | 15,297 | 11,939 | 15,911 | 13,508 | 13,537 | 11,390 | 10,103 | 12,338 | 11,271 | 11,523 | 13,277 | 12,152 |
| 2019 | 13,950 | 11,189 | 12,081 | 12,786 | 12,331 | 12,421 | 11,687 | 12,378 | 10,988 | 12,893 | 11,469 | 14,191 |
| 2020 | 12,376 | 12,594 | 12,824 | 7,640 | 9,119 | 12,278 | 12,448 | 11,693 | 12,004 | 12,549 | 12,407 | 14,692 |
| 2021 | 12,732 | 10,516 | 12,332 | 12,586 | 14,362 | 12,946 | 12,861 | 12,834 | 11,935 | 11,838 | 13,276 | 13,417 |
| 2022 | 12,939 | 12,899 | 13,158 | 13,813 | 13,232 | 13,155 | 14,106 | 14,425 | 11,833 | 15,107 | 15,636 | 14,382 |
| 2023 | 15,073 | 13,083 | 14,023 | 11,904 | 13,652 | 14,320 | 14,474 | 13,256 | 13,474 | 17,800 | 16,873 | 16,157 |
| 2024 | 16,537 | |||||||||||
| - = No Data Reported; -- = Not Applicable; NA = Not Available; W = Withheld to avoid disclosure of individual company data. |
| Release Date: 3/29/2024 |
| Next Release Date: 4/30/2024 |