|
Download Data (XLS File) |
|
||||||||
|
||||||||
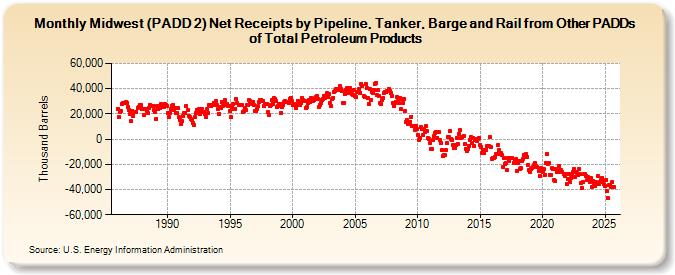
| Midwest (PADD 2) Net Receipts by Pipeline, Tanker, Barge and Rail from Other PADDs of Total Petroleum Products (Thousand Barrels) | ||||||||
| Year | Jan | Feb | Mar | Apr | May | Jun | Jul | Aug | Sep | Oct | Nov | Dec |
|---|---|---|---|---|---|---|---|---|---|---|---|---|
| 1986 | 24,234 | 17,859 | 21,758 | 22,651 | 27,861 | 28,558 | 28,777 | 28,921 | 29,379 | 28,921 | 25,628 | 22,943 |
| 1987 | 20,190 | 14,341 | 22,349 | 18,636 | 21,320 | 21,393 | 21,526 | 24,710 | 25,772 | 27,363 | 27,372 | 23,578 |
| 1988 | 23,697 | 18,897 | 23,914 | 24,237 | 22,467 | 20,362 | 24,941 | 27,266 | 26,133 | 26,442 | 26,351 | 22,717 |
| 1989 | 21,236 | 16,331 | 26,554 | 23,952 | 25,226 | 24,469 | 27,746 | 26,618 | 25,443 | 27,840 | 26,998 | 25,869 |
| 1990 | 20,847 | 17,224 | 20,788 | 23,623 | 26,572 | 27,268 | 23,033 | 24,735 | 20,657 | 20,793 | 24,549 | 17,237 |
| 1991 | 15,182 | 12,313 | 13,982 | 18,172 | 20,869 | 20,636 | 26,122 | 22,895 | 18,528 | 17,826 | 16,091 | 15,072 |
| 1992 | 13,110 | 11,001 | 17,668 | 20,337 | 23,397 | 22,301 | 23,507 | 19,977 | 21,799 | 23,487 | 21,261 | 21,449 |
| 1993 | 20,266 | 17,455 | 23,979 | 20,770 | 26,858 | 27,361 | 26,181 | 26,769 | 28,969 | 28,516 | 29,908 | 26,819 |
| 1994 | 23,491 | 20,115 | 25,328 | 24,612 | 29,319 | 26,624 | 27,954 | 30,745 | 26,989 | 27,619 | 26,141 | 26,249 |
| 1995 | 22,132 | 17,293 | 25,587 | 28,010 | 23,705 | 24,185 | 31,781 | 28,324 | 27,179 | 26,961 | 27,340 | 27,185 |
| 1996 | 21,739 | 22,110 | 24,589 | 23,453 | 26,908 | 27,014 | 30,938 | 30,431 | 29,511 | 27,849 | 29,701 | 27,237 |
| 1997 | 22,536 | 21,991 | 23,647 | 25,977 | 29,602 | 30,787 | 31,363 | 30,586 | 25,909 | 28,140 | 28,156 | 27,617 |
| 1998 | 21,456 | 19,369 | 25,938 | 27,351 | 31,048 | 27,920 | 32,472 | 32,151 | 29,952 | 25,757 | 26,289 | 27,942 |
| 1999 | 28,245 | 20,992 | 25,143 | 27,096 | 29,432 | 30,094 | 29,658 | 29,484 | 28,429 | 32,140 | 32,988 | 30,610 |
| 2000 | 26,852 | 28,176 | 26,957 | 24,940 | 26,695 | 30,606 | 29,616 | 26,933 | 28,791 | 32,413 | 30,649 | 30,439 |
| 2001 | 30,281 | 24,686 | 25,636 | 28,849 | 30,964 | 29,614 | 32,420 | 29,980 | 31,182 | 32,340 | 33,238 | 34,073 |
| 2002 | 31,642 | 25,418 | 26,815 | 28,327 | 30,973 | 31,831 | 34,430 | 32,329 | 33,806 | 36,248 | 33,760 | 36,059 |
| 2003 | 28,541 | 26,344 | 31,579 | 33,007 | 37,591 | 38,426 | 39,384 | 39,704 | 38,867 | 41,994 | 39,444 | 38,469 |
| 2004 | 28,829 | 29,033 | 36,021 | 39,011 | 40,262 | 36,928 | 40,136 | 40,702 | 37,102 | 35,432 | 35,099 | 38,738 |
| 2005 | 34,118 | 33,353 | 37,062 | 37,556 | 40,128 | 36,972 | 43,842 | 42,155 | 34,179 | 33,461 | 43,376 | 40,335 |
| 2006 | 32,525 | 28,018 | 39,642 | 31,391 | 37,737 | 36,315 | 39,091 | 43,724 | 44,810 | 35,206 | 38,657 | 33,921 |
| 2007 | 28,374 | 27,782 | 30,844 | 32,556 | 36,604 | 37,612 | 37,411 | 38,435 | 39,930 | 38,153 | 36,583 | 34,452 |
| 2008 | 28,686 | 26,598 | 28,603 | 29,727 | 33,258 | 29,899 | 28,338 | 32,266 | 23,599 | 32,128 | 28,666 | 32,141 |
| 2009 | 21,959 | 13,875 | 15,094 | 11,856 | 11,706 | 13,844 | 17,792 | 10,266 | 10,718 | 7,394 | 10,700 | 7,694 |
| 2010 | 3,508 | -959 | 769 | 9,277 | 7,740 | 3,076 | 7,666 | 5,515 | 10,172 | 6,791 | 1,111 | 100 |
| 2011 | -2,833 | -7,911 | -7,575 | -647 | 2,470 | 4,653 | 5,534 | 1,113 | 5,650 | -777 | -2,983 | -8,741 |
| 2012 | -13,631 | -12,411 | -12,800 | -8,715 | -3,316 | 2,010 | 1,960 | 6,403 | 452 | -644 | -4,904 | -6,794 |
| 2013 | -7,022 | -4,694 | 1,109 | -3,495 | 4,180 | 6,838 | 899 | 1,272 | 2,373 | -4,124 | -7,598 | -9,578 |
| 2014 | -7,926 | -5,303 | -865 | 1,579 | -3,324 | 647 | -5,181 | -902 | -228 | -1,296 | 97 | 1,250 |
| 2015 | -4,633 | -6,309 | -10,780 | -8,393 | -11,272 | -8,737 | -8,303 | -5,454 | -5,499 | 1,474 | -6,553 | -15,573 |
| 2016 | -14,665 | -14,966 | -14,510 | -11,848 | -12,120 | -5,020 | -8,857 | -11,634 | -10,985 | -12,855 | -22,497 | -15,178 |
| 2017 | -19,455 | -19,054 | -24,720 | -15,055 | -17,030 | -15,198 | -15,208 | -15,040 | -19,072 | -17,304 | -16,124 | -25,048 |
| 2018 | -18,787 | -17,277 | -23,884 | -22,693 | -17,701 | -15,537 | -12,387 | -13,808 | -11,684 | -14,231 | -20,744 | -24,384 |
| 2019 | -25,906 | -23,346 | -22,784 | -22,114 | -20,815 | -19,304 | -21,632 | -22,257 | -25,576 | -28,899 | -22,638 | -24,170 |
| 2020 | -25,728 | -23,847 | -28,807 | -19,065 | -11,592 | -19,433 | -19,182 | -28,169 | -28,095 | -23,111 | -23,794 | -32,670 |
| 2021 | -33,390 | -23,353 | -26,130 | -26,414 | -21,681 | -24,818 | -24,739 | -25,743 | -27,306 | -28,967 | -27,752 | -35,344 |
| 2022 | -31,904 | -27,739 | -33,832 | -31,242 | -28,362 | -26,472 | -23,663 | -30,385 | -26,413 | -26,772 | -28,733 | -24,103 |
| 2023 | -28,023 | -34,537 | -36,674 | -33,183 | -27,973 | -27,570 | -29,060 | -32,500 | -31,006 | -34,357 | -31,063 | -36,548 |
| 2024 | -32,810 | |||||||||||
| - = No Data Reported; -- = Not Applicable; NA = Not Available; W = Withheld to avoid disclosure of individual company data. |
| Release Date: 3/29/2024 |
| Next Release Date: 4/30/2024 |