|
Download Data (XLS File) |
|
||||||||
|
||||||||
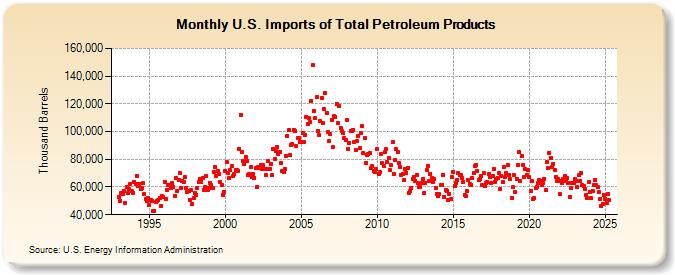
| U.S. Imports of Total Petroleum Products (Thousand Barrels) | ||||||||
| Year | Jan | Feb | Mar | Apr | May | Jun | Jul | Aug | Sep | Oct | Nov | Dec |
|---|---|---|---|---|---|---|---|---|---|---|---|---|
| 1993 | 53,065 | 50,187 | 55,720 | 55,203 | 57,465 | 48,114 | 59,828 | 55,455 | 58,505 | 62,479 | 57,189 | 56,014 |
| 1994 | 63,478 | 62,319 | 68,277 | 60,391 | 62,474 | 58,424 | 59,571 | 62,696 | 54,749 | 51,195 | 50,205 | 51,770 |
| 1995 | 46,793 | 50,366 | 50,067 | 42,820 | 42,898 | 48,941 | 49,550 | 50,350 | 51,857 | 46,577 | 53,160 | 52,564 |
| 1996 | 63,900 | 51,550 | 58,189 | 61,739 | 61,300 | 59,400 | 62,635 | 60,279 | 53,656 | 66,224 | 57,014 | 65,403 |
| 1997 | 70,403 | 59,547 | 64,447 | 63,812 | 67,123 | 59,331 | 56,734 | 57,160 | 50,912 | 57,812 | 47,463 | 51,927 |
| 1998 | 55,421 | 54,482 | 59,226 | 63,590 | 65,624 | 63,948 | 66,407 | 57,513 | 59,948 | 68,023 | 57,600 | 59,080 |
| 1999 | 62,961 | 61,095 | 59,481 | 70,856 | 74,776 | 68,148 | 71,485 | 69,243 | 63,896 | 61,458 | 54,274 | 56,738 |
| 2000 | 71,636 | 77,837 | 70,099 | 66,510 | 72,258 | 74,960 | 67,881 | 69,249 | 72,468 | 71,948 | 71,885 | 87,539 |
| 2001 | 112,301 | 84,966 | 78,420 | 76,266 | 81,960 | 78,799 | 68,437 | 69,401 | 74,347 | 67,203 | 69,260 | 66,784 |
| 2002 | 73,772 | 60,216 | 74,364 | 73,930 | 75,823 | 72,867 | 75,626 | 72,724 | 68,326 | 73,196 | 78,404 | 73,115 |
| 2003 | 76,599 | 68,519 | 87,376 | 80,140 | 85,725 | 88,872 | 83,755 | 85,139 | 77,417 | 71,599 | 70,839 | 72,825 |
| 2004 | 82,672 | 96,894 | 101,072 | 83,047 | 90,613 | 90,828 | 101,409 | 100,096 | 89,355 | 95,344 | 95,105 | 92,606 |
| 2005 | 92,819 | 98,853 | 92,622 | 97,550 | 110,774 | 105,152 | 109,987 | 106,750 | 122,214 | 147,708 | 115,030 | 110,111 |
| 2006 | 124,915 | 100,289 | 97,769 | 107,362 | 124,358 | 106,210 | 116,377 | 128,119 | 113,423 | 99,546 | 93,508 | 98,125 |
| 2007 | 108,342 | 88,601 | 110,867 | 110,443 | 120,171 | 106,150 | 118,254 | 102,858 | 100,180 | 99,079 | 95,528 | 94,080 |
| 2008 | 108,080 | 87,704 | 91,816 | 100,571 | 100,373 | 101,414 | 92,762 | 86,595 | 93,463 | 96,588 | 88,112 | 98,822 |
| 2009 | 103,789 | 84,600 | 95,113 | 77,628 | 83,058 | 84,029 | 84,816 | 73,423 | 75,056 | 71,676 | 70,951 | 73,296 |
| 2010 | 87,066 | 69,150 | 70,680 | 84,003 | 77,079 | 75,503 | 85,021 | 87,208 | 77,814 | 80,689 | 71,918 | 75,546 |
| 2011 | 92,436 | 69,721 | 79,723 | 87,205 | 85,164 | 77,119 | 74,657 | 68,984 | 69,357 | 65,036 | 72,960 | 70,426 |
| 2012 | 73,867 | 55,905 | 56,871 | 59,238 | 65,917 | 66,937 | 64,543 | 68,668 | 62,825 | 60,130 | 59,955 | 63,241 |
| 2013 | 66,128 | 55,828 | 63,162 | 72,218 | 75,426 | 64,521 | 69,508 | 66,637 | 63,390 | 66,041 | 59,315 | 54,800 |
| 2014 | 53,189 | 54,768 | 61,447 | 61,363 | 68,827 | 53,084 | 57,829 | 57,229 | 50,584 | 55,058 | 51,415 | 67,485 |
| 2015 | 70,982 | 60,819 | 62,836 | 64,987 | 69,966 | 68,521 | 68,552 | 66,397 | 63,898 | 53,916 | 53,402 | 57,049 |
| 2016 | 64,850 | 62,423 | 61,655 | 66,315 | 69,851 | 74,823 | 75,508 | 71,508 | 64,768 | 66,005 | 68,085 | 61,228 |
| 2017 | 70,287 | 60,373 | 62,576 | 63,538 | 69,506 | 67,082 | 63,214 | 67,874 | 72,866 | 63,860 | 66,056 | 66,738 |
| 2018 | 70,130 | 58,456 | 68,273 | 63,641 | 74,169 | 67,158 | 69,973 | 75,794 | 68,872 | 65,531 | 51,918 | 59,636 |
| 2019 | 68,503 | 56,042 | 65,775 | 75,786 | 84,912 | 64,339 | 82,541 | 75,712 | 66,868 | 73,082 | 68,565 | 72,106 |
| 2020 | 67,236 | 56,908 | 64,002 | 51,634 | 51,931 | 59,240 | 60,128 | 63,013 | 64,824 | 64,556 | 61,359 | 62,792 |
| 2021 | 66,085 | 57,646 | 77,732 | 73,491 | 84,653 | 81,039 | 74,503 | 76,805 | 72,260 | 67,115 | 64,231 | 65,868 |
| 2022 | 55,165 | 64,310 | 62,982 | 65,633 | 67,720 | 64,542 | 66,552 | 63,064 | 52,804 | 59,080 | 62,670 | 62,825 |
| 2023 | 65,873 | 64,292 | 60,154 | 68,274 | 64,567 | 70,276 | 61,485 | 60,422 | 58,037 | 54,485 | 51,936 | 63,278 |
| 2024 | 56,471 | |||||||||||
| - = No Data Reported; -- = Not Applicable; NA = Not Available; W = Withheld to avoid disclosure of individual company data. |
| Release Date: 3/29/2024 |
| Next Release Date: 4/30/2024 |