|
Download Data (XLS File) |
|
||||||||
|
||||||||
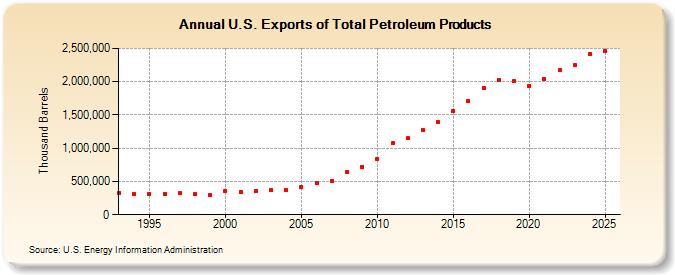
| U.S. Exports of Total Petroleum Products (Thousand Barrels) | ||||||||
| Decade | Year-0 | Year-1 | Year-2 | Year-3 | Year-4 | Year-5 | Year-6 | Year-7 | Year-8 | Year-9 |
|---|---|---|---|---|---|---|---|---|---|---|
| 1990's | 330,140 | 307,875 | 311,967 | 318,686 | 326,950 | 304,655 | 299,985 | |||
| 2000's | 362,357 | 347,035 | 355,781 | 370,171 | 373,853 | 413,571 | 471,562 | 512,873 | 648,928 | 722,819 |
| 2010's | 843,486 | 1,072,690 | 1,148,272 | 1,272,819 | 1,395,937 | 1,559,637 | 1,709,095 | 1,904,638 | 2,026,911 | 2,003,724 |
| 2020's | 1,936,909 | 2,034,173 | 2,169,421 | 2,245,834 |
| - = No Data Reported; -- = Not Applicable; NA = Not Available; W = Withheld to avoid disclosure of individual company data. |
| Release Date: 8/30/2024 |
| Next Release Date: 8/29/2025 |