|
Download Data (XLS File) |
|
||||||||
|
||||||||
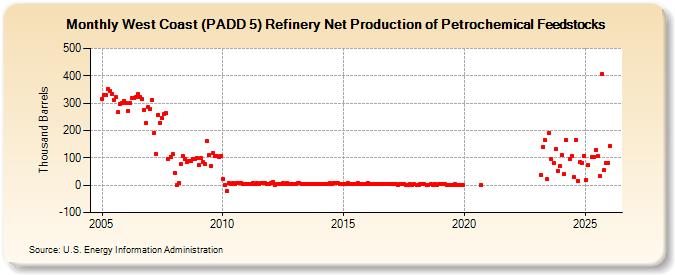
| West Coast (PADD 5) Refinery Net Production of Petrochemical Feedstocks (Thousand Barrels) | ||||||||
| Year | Jan | Feb | Mar | Apr | May | Jun | Jul | Aug | Sep | Oct | Nov | Dec |
|---|---|---|---|---|---|---|---|---|---|---|---|---|
| 2005 | 316 | 330 | 329 | 351 | 345 | 334 | 312 | 321 | 266 | 298 | 299 | 307 |
| 2006 | 302 | 271 | 301 | 318 | 319 | 323 | 333 | 323 | 315 | 276 | 226 | 284 |
| 2007 | 277 | 312 | 191 | 113 | 257 | 229 | 244 | 260 | 263 | 97 | 104 | 113 |
| 2008 | 44 | 1 | 7 | 76 | 106 | 95 | 86 | 89 | 90 | 94 | 95 | 100 |
| 2009 | 72 | 98 | 83 | 76 | 160 | 109 | 69 | 118 | 105 | 105 | 103 | 107 |
| 2010 | 22 | 0 | -23 | 7 | 6 | 7 | 6 | 8 | 7 | 8 | 4 | 5 |
| 2011 | 6 | 6 | 6 | 7 | 3 | 8 | 6 | 7 | 7 | 8 | 6 | 6 |
| 2012 | 8 | 11 | 0 | 6 | 5 | 4 | 7 | 6 | 7 | 4 | 4 | 4 |
| 2013 | 3 | 7 | 8 | 5 | 3 | 4 | 4 | 6 | 5 | 5 | 6 | 4 |
| 2014 | 5 | 5 | 5 | 5 | 6 | 7 | 5 | 8 | 7 | 7 | 6 | 6 |
| 2015 | 5 | 6 | 7 | 6 | 4 | 5 | 5 | 8 | 4 | 5 | 4 | 5 |
| 2016 | 7 | 4 | 3 | 3 | 3 | 3 | 3 | 4 | 4 | 4 | 3 | 3 |
| 2017 | 3 | 3 | 3 | 2 | 4 | 3 | 4 | 2 | 1 | 4 | 2 | 3 |
| 2018 | 2 | 2 | 3 | 3 | 3 | 2 | 2 | 3 | 1 | 3 | 2 | 3 |
| 2019 | 3 | 4 | 4 | 1 | 1 | 2 | 1 | 3 | 1 | 2 | 1 | 1 |
| 2020 | 2 | |||||||||||
| 2023 | 38 | 140 | 164 | 21 | 191 | 95 | 82 | 131 | 53 | 69 | ||
| 2024 | 110 | |||||||||||
| - = No Data Reported; -- = Not Applicable; NA = Not Available; W = Withheld to avoid disclosure of individual company data. |
| Release Date: 3/29/2024 |
| Next Release Date: 4/30/2024 |