|
Download Data (XLS File) |
|
||||||||
|
||||||||
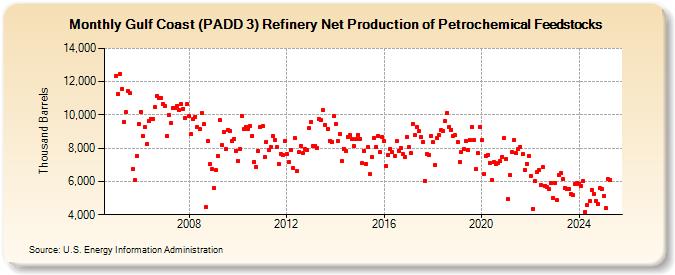
| Gulf Coast (PADD 3) Refinery Net Production of Petrochemical Feedstocks (Thousand Barrels) | ||||||||
| Year | Jan | Feb | Mar | Apr | May | Jun | Jul | Aug | Sep | Oct | Nov | Dec |
|---|---|---|---|---|---|---|---|---|---|---|---|---|
| 2005 | 12,367 | 11,247 | 12,465 | 11,582 | 9,599 | 10,148 | 11,412 | 11,297 | 6,721 | 6,066 | 7,523 | 9,446 |
| 2006 | 10,197 | 8,759 | 9,288 | 8,227 | 9,630 | 9,776 | 9,765 | 10,461 | 11,147 | 11,002 | 11,020 | 10,673 |
| 2007 | 10,551 | 8,737 | 10,024 | 9,516 | 10,427 | 10,429 | 10,560 | 10,279 | 10,645 | 10,382 | 9,817 | 10,647 |
| 2008 | 9,909 | 8,843 | 9,756 | 9,884 | 9,267 | 9,140 | 10,113 | 9,428 | 4,437 | 8,427 | 7,033 | 6,747 |
| 2009 | 5,608 | 6,664 | 7,558 | 9,685 | 8,204 | 8,985 | 7,940 | 9,109 | 9,014 | 8,405 | 8,579 | 7,845 |
| 2010 | 7,222 | 7,959 | 9,925 | 9,166 | 9,287 | 9,179 | 9,341 | 8,748 | 7,192 | 6,839 | 7,803 | 9,259 |
| 2011 | 9,307 | 7,457 | 8,396 | 7,920 | 8,071 | 8,721 | 8,496 | 8,063 | 7,032 | 7,664 | 7,578 | 8,414 |
| 2012 | 7,637 | 7,167 | 7,884 | 6,808 | 8,603 | 6,643 | 7,775 | 8,156 | 7,711 | 7,924 | 7,889 | 9,186 |
| 2013 | 9,585 | 8,152 | 8,154 | 7,988 | 9,758 | 9,690 | 10,279 | 9,412 | 9,171 | 8,436 | 8,365 | 9,912 |
| 2014 | 9,457 | 8,425 | 8,863 | 7,208 | 7,981 | 7,805 | 8,700 | 8,767 | 8,550 | 8,160 | 8,575 | 8,819 |
| 2015 | 8,560 | 7,092 | 7,853 | 7,065 | 8,064 | 6,431 | 7,473 | 8,636 | 8,067 | 8,762 | 7,748 | 8,669 |
| 2016 | 8,442 | 6,899 | 7,582 | 7,961 | 7,780 | 7,559 | 8,402 | 7,854 | 7,992 | 7,634 | 7,494 | 8,690 |
| 2017 | 8,052 | 7,697 | 9,475 | 8,764 | 9,281 | 9,037 | 8,683 | 8,361 | 6,049 | 7,671 | 7,610 | 8,753 |
| 2018 | 8,356 | 6,984 | 8,621 | 8,780 | 9,066 | 9,061 | 9,639 | 10,118 | 9,295 | 9,114 | 8,754 | 8,768 |
| 2019 | 8,391 | 7,180 | 7,758 | 7,931 | 8,437 | 7,880 | 8,502 | 9,245 | 8,474 | 6,762 | 7,695 | 9,296 |
| 2020 | 8,463 | 6,418 | 7,531 | 7,583 | 7,135 | 6,098 | 7,174 | 7,020 | 7,110 | 7,218 | 7,490 | 8,625 |
| 2021 | 7,343 | 4,916 | 6,377 | 7,764 | 8,491 | 7,707 | 7,974 | 8,076 | 7,624 | 6,714 | 7,068 | 7,517 |
| 2022 | 6,345 | 4,371 | 6,019 | 6,539 | 6,673 | 5,787 | 6,853 | 5,748 | 5,680 | 5,520 | 5,911 | 5,031 |
| 2023 | 5,881 | 4,809 | 6,386 | 6,505 | 6,116 | 5,637 | 5,568 | 5,537 | 5,245 | 5,168 | 5,892 | 5,900 |
| 2024 | 5,872 | 5,736 | 6,002 | 4,156 | ||||||||
| - = No Data Reported; -- = Not Applicable; NA = Not Available; W = Withheld to avoid disclosure of individual company data. |
| Release Date: 6/28/2024 |
| Next Release Date: 7/31/2024 |