|
Download Data (XLS File) |
|
||||||||
|
||||||||
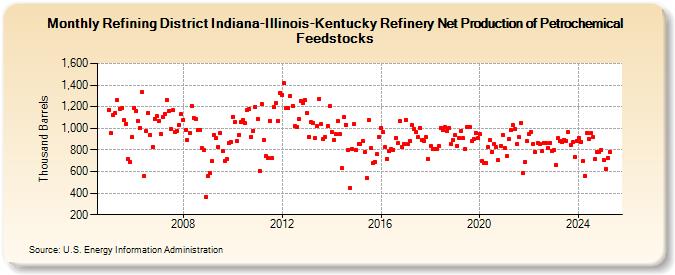
| Refining District Indiana-Illinois-Kentucky Refinery Net Production of Petrochemical Feedstocks (Thousand Barrels) | ||||||||
| Year | Jan | Feb | Mar | Apr | May | Jun | Jul | Aug | Sep | Oct | Nov | Dec |
|---|---|---|---|---|---|---|---|---|---|---|---|---|
| 2005 | 1,172 | 952 | 1,119 | 1,142 | 1,266 | 1,181 | 1,185 | 1,076 | 1,042 | 713 | 690 | 920 |
| 2006 | 1,189 | 1,158 | 1,066 | 1,001 | 1,332 | 560 | 972 | 1,145 | 940 | 827 | 1,090 | 1,112 |
| 2007 | 1,069 | 949 | 1,108 | 1,135 | 1,262 | 1,160 | 991 | 1,166 | 968 | 976 | 1,031 | 1,129 |
| 2008 | 1,077 | 983 | 895 | 959 | 1,209 | 1,099 | 1,088 | 988 | 988 | 816 | 799 | 365 |
| 2009 | 560 | 588 | 699 | 937 | 910 | 826 | 958 | 786 | 700 | 713 | 861 | 871 |
| 2010 | 1,109 | 1,057 | 884 | 942 | 1,057 | 1,078 | 1,047 | 1,167 | 1,180 | 923 | 978 | 1,200 |
| 2011 | 1,084 | 608 | 1,226 | 893 | 741 | 724 | 1,072 | 724 | 1,196 | 1,236 | 1,071 | 1,328 |
| 2012 | 1,311 | 1,416 | 1,185 | 1,184 | 1,300 | 1,211 | 1,017 | 1,014 | 1,087 | 1,254 | 1,237 | 1,263 |
| 2013 | 1,143 | 922 | 1,054 | 1,045 | 906 | 1,021 | 1,275 | 1,040 | 897 | 918 | 1,021 | 1,206 |
| 2014 | 966 | 895 | 943 | 1,063 | 943 | 632 | 1,101 | 1,034 | 797 | 451 | 810 | 1,037 |
| 2015 | 799 | 859 | 857 | 886 | 777 | 540 | 1,077 | 815 | 678 | 690 | 759 | 924 |
| 2016 | 1,002 | 962 | 823 | 717 | 786 | 810 | 800 | 910 | 860 | 1,065 | 826 | 853 |
| 2017 | 1,080 | 852 | 882 | 1,029 | 992 | 964 | 915 | 1,005 | 895 | 883 | 915 | 717 |
| 2018 | 837 | 805 | 810 | 808 | 832 | 1,007 | 981 | 1,008 | 971 | 1,003 | 856 | 888 |
| 2019 | 934 | 840 | 911 | 975 | 906 | 805 | 1,010 | 1,013 | 879 | 903 | 957 | 907 |
| 2020 | 947 | 693 | 678 | 675 | 826 | 892 | 785 | 856 | 828 | 705 | 834 | 940 |
| 2021 | 817 | 740 | 897 | 980 | 1,031 | 995 | 856 | 916 | 1,052 | 585 | 689 | 879 |
| 2022 | 951 | 968 | 858 | 777 | 865 | 859 | 786 | 867 | 865 | 821 | 864 | 788 |
| 2023 | 800 | 658 | 906 | 882 | 872 | 894 | 883 | 964 | 843 | 873 | 731 | 882 |
| 2024 | 914 | |||||||||||
| - = No Data Reported; -- = Not Applicable; NA = Not Available; W = Withheld to avoid disclosure of individual company data. |
| Release Date: 3/29/2024 |
| Next Release Date: 4/30/2024 |