|
Download Data (XLS File) |
|
||||||||
|
||||||||
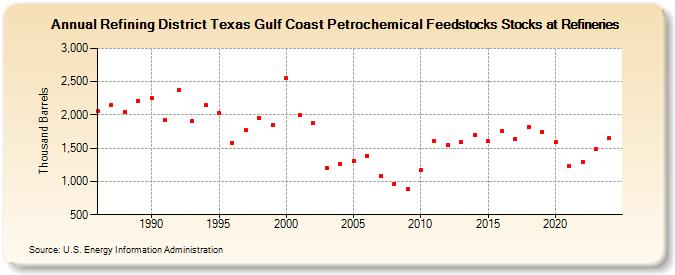
| Refining District Texas Gulf Coast Petrochemical Feedstocks Stocks at Refineries (Thousand Barrels) | ||||||||
| Decade | Year-0 | Year-1 | Year-2 | Year-3 | Year-4 | Year-5 | Year-6 | Year-7 | Year-8 | Year-9 |
|---|---|---|---|---|---|---|---|---|---|---|
| 1980's | 2,052 | 2,152 | 2,045 | 2,211 | ||||||
| 1990's | 2,257 | 1,923 | 2,372 | 1,910 | 2,144 | 2,023 | 1,584 | 1,766 | 1,956 | 1,856 |
| 2000's | 2,550 | 1,992 | 1,876 | 1,205 | 1,257 | 1,310 | 1,384 | 1,088 | 966 | 889 |
| 2010's | 1,166 | 1,601 | 1,551 | 1,598 | 1,700 | 1,611 | 1,763 | 1,644 | 1,822 | 1,746 |
| 2020's | 1,590 | 1,233 | 1,295 | 1,481 |
| - = No Data Reported; -- = Not Applicable; NA = Not Available; W = Withheld to avoid disclosure of individual company data. |
| Release Date: 3/29/2024 |
| Next Release Date: 8/30/2024 |