|
Download Data (XLS File) |
|
||||||||
|
||||||||
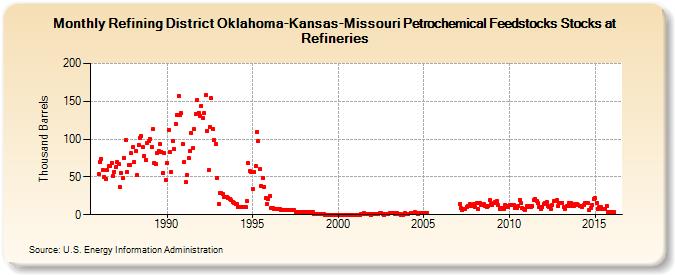
| Refining District Oklahoma-Kansas-Missouri Petrochemical Feedstocks Stocks at Refineries (Thousand Barrels) | ||||||||
| Year | Jan | Feb | Mar | Apr | May | Jun | Jul | Aug | Sep | Oct | Nov | Dec |
|---|---|---|---|---|---|---|---|---|---|---|---|---|
| 1986 | 54 | 70 | 74 | 59 | 50 | 47 | 59 | 64 | 64 | 69 | 51 | 57 |
| 1987 | 63 | 70 | 67 | 36 | 55 | 48 | 75 | 99 | 57 | 66 | 66 | 81 |
| 1988 | 89 | 70 | 84 | 52 | 92 | 102 | 104 | 89 | 78 | 73 | 95 | 97 |
| 1989 | 100 | 89 | 113 | 69 | 67 | 81 | 84 | 93 | 83 | 55 | 81 | 46 |
| 1990 | 68 | 112 | 83 | 57 | 98 | 87 | 120 | 132 | 157 | 132 | 134 | 93 |
| 1991 | 70 | 43 | 52 | 75 | 84 | 108 | 88 | 113 | 133 | 152 | 135 | 131 |
| 1992 | 144 | 128 | 134 | 158 | 111 | 59 | 116 | 154 | 114 | 99 | 93 | 49 |
| 1993 | 14 | 29 | 29 | 27 | 24 | 24 | 23 | 22 | 21 | 19 | 17 | 16 |
| 1994 | 14 | 14 | 10 | 10 | 10 | 10 | 10 | 10 | 18 | 68 | 58 | 56 |
| 1995 | 34 | 57 | 64 | 110 | 97 | 60 | 38 | 49 | 37 | 22 | 14 | 21 |
| 1996 | 25 | 9 | 9 | 8 | 8 | 8 | 8 | 8 | 6 | 6 | 6 | 6 |
| 1997 | 6 | 6 | 6 | 6 | 6 | 6 | 4 | 3 | 3 | 3 | 3 | 3 |
| 1998 | 3 | 3 | 3 | 3 | 3 | 3 | 3 | 1 | 1 | 1 | 1 | 1 |
| 1999 | 1 | 1 | 1 | 0 | 0 | 0 | 0 | 0 | 0 | 0 | 0 | 0 |
| 2000 | 0 | 0 | 0 | 0 | 0 | 0 | 0 | 0 | 0 | 0 | 0 | 0 |
| 2001 | 0 | 0 | 0 | 0 | 1 | 1 | 2 | 1 | 1 | 1 | 1 | 0 |
| 2002 | 1 | 1 | 1 | 1 | 1 | 2 | 2 | 1 | 0 | 1 | 1 | 1 |
| 2003 | 2 | 2 | 2 | 2 | 1 | 2 | 1 | 1 | 0 | 0 | 1 | 2 |
| 2004 | 1 | 1 | 2 | 2 | 2 | 3 | 2 | 1 | 2 | 2 | 2 | |
| 2005 | 2 | 2 | 2 | |||||||||
| 2007 | 14 | 9 | 6 | 7 | 8 | 10 | 12 | 14 | 11 | 13 | 14 | |
| 2008 | 10 | 16 | 7 | 15 | 13 | 13 | 14 | 12 | 10 | 11 | 19 | 14 |
| 2009 | 13 | 15 | 17 | 18 | 13 | 8 | 9 | 9 | 8 | 13 | 12 | 10 |
| 2010 | 13 | 13 | 13 | 13 | 9 | 9 | 11 | 20 | 15 | 9 | 7 | 6 |
| 2011 | 11 | 10 | 11 | 10 | 12 | 19 | 21 | 18 | 15 | 10 | 8 | 10 |
| 2012 | 14 | 16 | 17 | 12 | 10 | 7 | 13 | 18 | 18 | 19 | 12 | 16 |
| 2013 | 15 | 16 | 10 | 8 | 11 | 11 | 15 | 16 | 11 | 12 | 14 | 14 |
| 2014 | 13 | 12 | 11 | 10 | 13 | 15 | 15 | 15 | 6 | 9 | 13 | 21 |
| 2015 | 22 | 16 | 8 | 10 | 10 | 8 | 8 | 8 | 12 | 4 | 4 | 4 |
| 2016 | 4 | 3 | ||||||||||
| - = No Data Reported; -- = Not Applicable; NA = Not Available; W = Withheld to avoid disclosure of individual company data. |
| Release Date: 3/29/2024 |
| Next Release Date: 4/30/2024 |