|
Download Data (XLS File) |
|
||||||||
|
||||||||
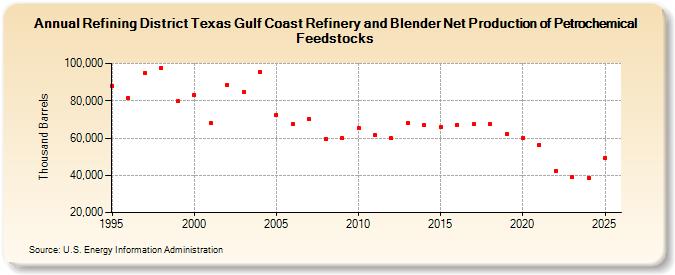
| Refining District Texas Gulf Coast Refinery and Blender Net Production of Petrochemical Feedstocks (Thousand Barrels) | ||||||||
| Decade | Year-0 | Year-1 | Year-2 | Year-3 | Year-4 | Year-5 | Year-6 | Year-7 | Year-8 | Year-9 |
|---|---|---|---|---|---|---|---|---|---|---|
| 1990's | 88,064 | 81,504 | 94,956 | 97,760 | 79,779 | |||||
| 2000's | 82,897 | 68,156 | 88,529 | 84,492 | 95,677 | 72,477 | 67,654 | 70,216 | 59,673 | 59,941 |
| 2010's | 65,165 | 61,494 | 59,815 | 67,823 | 66,816 | 66,035 | 66,987 | 67,328 | 67,623 | 61,914 |
| 2020's | 60,177 | 56,267 | 42,519 | 38,847 |
| - = No Data Reported; -- = Not Applicable; NA = Not Available; W = Withheld to avoid disclosure of individual company data. |
| Release Date: 8/30/2024 |
| Next Release Date: 8/29/2025 |