|
Download Data (XLS File) |
|
||||||||
|
||||||||
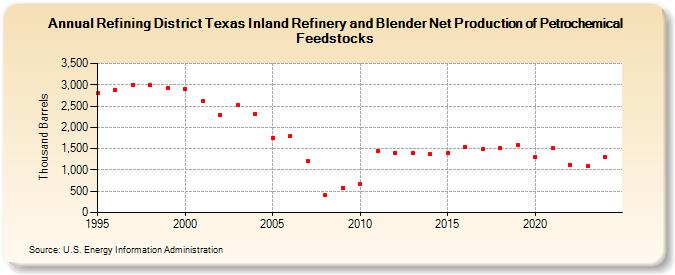
| Refining District Texas Inland Refinery and Blender Net Production of Petrochemical Feedstocks (Thousand Barrels) | ||||||||
| Decade | Year-0 | Year-1 | Year-2 | Year-3 | Year-4 | Year-5 | Year-6 | Year-7 | Year-8 | Year-9 |
|---|---|---|---|---|---|---|---|---|---|---|
| 1990's | 2,805 | 2,884 | 3,006 | 2,993 | 2,914 | |||||
| 2000's | 2,894 | 2,609 | 2,296 | 2,530 | 2,316 | 1,759 | 1,804 | 1,201 | 405 | 587 |
| 2010's | 663 | 1,439 | 1,410 | 1,402 | 1,364 | 1,406 | 1,538 | 1,498 | 1,513 | 1,582 |
| 2020's | 1,304 | 1,504 | 1,122 | 1,086 |
| - = No Data Reported; -- = Not Applicable; NA = Not Available; W = Withheld to avoid disclosure of individual company data. |
| Release Date: 3/29/2024 |
| Next Release Date: 8/30/2024 |