|
Download Data (XLS File) |
|
||||||||
|
||||||||
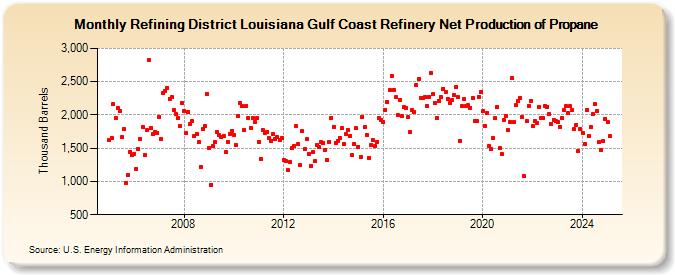
| Refining District Louisiana Gulf Coast Refinery Net Production of Propane (Thousand Barrels) | ||||||||
| Year | Jan | Feb | Mar | Apr | May | Jun | Jul | Aug | Sep | Oct | Nov | Dec |
|---|---|---|---|---|---|---|---|---|---|---|---|---|
| 2005 | 1,624 | 1,660 | 2,157 | 1,961 | 2,098 | 2,063 | 1,662 | 1,783 | 977 | 1,091 | 1,447 | 1,392 |
| 2006 | 1,417 | 1,188 | 1,487 | 1,642 | 1,817 | 1,397 | 1,769 | 2,824 | 1,804 | 1,713 | 1,742 | 1,733 |
| 2007 | 1,972 | 1,632 | 2,334 | 2,367 | 2,405 | 2,244 | 2,262 | 2,073 | 2,021 | 1,953 | 1,833 | 2,181 |
| 2008 | 2,056 | 1,726 | 2,040 | 1,864 | 1,907 | 1,682 | 1,718 | 1,591 | 1,220 | 1,783 | 1,832 | 2,315 |
| 2009 | 1,510 | 952 | 1,526 | 1,589 | 1,736 | 1,698 | 1,664 | 1,688 | 1,449 | 1,596 | 1,714 | 1,765 |
| 2010 | 1,696 | 1,544 | 1,987 | 2,176 | 2,129 | 1,769 | 2,136 | 1,952 | 1,810 | 1,953 | 1,900 | 1,947 |
| 2011 | 1,594 | 1,340 | 1,774 | 1,733 | 1,745 | 1,652 | 1,614 | 1,710 | 1,644 | 1,664 | 1,623 | 1,656 |
| 2012 | 1,317 | 1,304 | 1,169 | 1,295 | 1,498 | 1,534 | 1,826 | 1,559 | 1,242 | 1,758 | 1,488 | 1,631 |
| 2013 | 1,415 | 1,239 | 1,438 | 1,302 | 1,548 | 1,512 | 1,588 | 1,573 | 1,477 | 1,325 | 1,595 | 1,956 |
| 2014 | 1,825 | 1,578 | 1,609 | 1,659 | 1,798 | 1,560 | 1,709 | 1,769 | 1,689 | 1,393 | 1,565 | 1,796 |
| 2015 | 1,524 | 1,367 | 1,972 | 1,815 | 1,703 | 1,357 | 1,543 | 1,620 | 1,533 | 1,599 | 1,950 | 1,931 |
| 2016 | 1,891 | 2,075 | 2,196 | 2,374 | 2,589 | 2,379 | 2,262 | 1,992 | 2,227 | 1,987 | 2,115 | 2,104 |
| 2017 | 1,962 | 1,747 | 2,067 | 2,048 | 2,457 | 2,538 | 2,256 | 2,255 | 2,270 | 2,133 | 2,274 | 2,637 |
| 2018 | 2,311 | 2,178 | 1,949 | 2,213 | 2,263 | 2,395 | 2,346 | 2,244 | 2,178 | 2,224 | 2,299 | 2,421 |
| 2019 | 2,268 | 1,612 | 2,134 | 2,238 | 2,141 | 2,142 | 2,110 | 2,261 | 1,905 | 1,904 | 2,274 | 2,349 |
| 2020 | 2,053 | 1,826 | 2,029 | 1,527 | 1,488 | 1,658 | 1,948 | 2,123 | 1,501 | 1,420 | 1,917 | 1,987 |
| 2021 | 1,767 | 1,899 | 2,554 | 1,888 | 2,144 | 2,213 | 2,260 | 1,970 | 1,077 | 1,905 | 2,139 | 2,216 |
| 2022 | 1,828 | 1,902 | 1,880 | 2,118 | 1,955 | 1,953 | 2,131 | 2,126 | 2,016 | 1,865 | 1,931 | 1,916 |
| 2023 | 1,899 | 1,824 | 1,947 | 2,072 | 2,131 | 2,026 | 2,127 | 2,074 | 1,784 | 1,854 | 1,452 | 1,786 |
| 2024 | 1,735 | |||||||||||
| - = No Data Reported; -- = Not Applicable; NA = Not Available; W = Withheld to avoid disclosure of individual company data. |
| Release Date: 3/29/2024 |
| Next Release Date: 4/30/2024 |