|
Download Data (XLS File) |
|
||||||||
|
||||||||
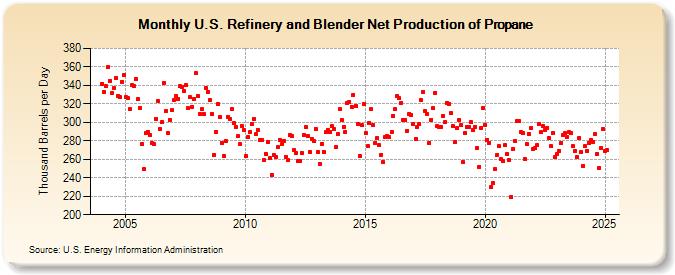
| U.S. Refinery and Blender Net Production of Propane (Thousand Barrels per Day) | ||||||||
| Year | Jan | Feb | Mar | Apr | May | Jun | Jul | Aug | Sep | Oct | Nov | Dec |
|---|---|---|---|---|---|---|---|---|---|---|---|---|
| 2004 | 342 | 333 | 339 | 360 | 345 | 332 | 337 | 348 | 329 | 327 | 344 | 351 |
| 2005 | 327 | 326 | 314 | 340 | 339 | 347 | 325 | 315 | 277 | 249 | 288 | 290 |
| 2006 | 286 | 278 | 276 | 304 | 323 | 293 | 300 | 343 | 312 | 288 | 303 | 313 |
| 2007 | 324 | 328 | 325 | 339 | 338 | 334 | 340 | 315 | 327 | 317 | 325 | 353 |
| 2008 | 329 | 309 | 314 | 309 | 337 | 333 | 324 | 309 | 265 | 290 | 320 | 306 |
| 2009 | 278 | 264 | 280 | 306 | 304 | 314 | 299 | 295 | 285 | 276 | 296 | 292 |
| 2010 | 264 | 284 | 289 | 298 | 304 | 287 | 292 | 281 | 281 | 259 | 266 | 279 |
| 2011 | 261 | 243 | 265 | 263 | 273 | 281 | 276 | 280 | 263 | 259 | 286 | 285 |
| 2012 | 270 | 267 | 258 | 258 | 267 | 286 | 295 | 285 | 268 | 282 | 280 | 293 |
| 2013 | 268 | 255 | 277 | 268 | 289 | 292 | 290 | 296 | 293 | 273 | 287 | 314 |
| 2014 | 303 | 295 | 290 | 321 | 322 | 317 | 330 | 318 | 298 | 264 | 297 | 320 |
| 2015 | 288 | 274 | 299 | 314 | 297 | 278 | 283 | 275 | 265 | 257 | 284 | 285 |
| 2016 | 284 | 290 | 307 | 314 | 328 | 326 | 321 | 303 | 302 | 291 | 309 | 308 |
| 2017 | 298 | 282 | 295 | 298 | 324 | 333 | 312 | 309 | 278 | 303 | 315 | 332 |
| 2018 | 296 | 295 | 295 | 307 | 300 | 321 | 320 | 310 | 296 | 279 | 294 | 303 |
| 2019 | 297 | 257 | 288 | 295 | 295 | 300 | 292 | 295 | 272 | 252 | 294 | 316 |
| 2020 | 297 | 281 | 278 | 230 | 234 | 249 | 265 | 274 | 260 | 258 | 275 | 266 |
| 2021 | 259 | 219 | 271 | 280 | 301 | 301 | 289 | 288 | 260 | 276 | 287 | 294 |
| 2022 | 271 | 272 | 275 | 298 | 289 | 296 | 292 | 294 | 283 | 274 | 288 | 262 |
| 2023 | 266 | 269 | 279 | 286 | 288 | 284 | 290 | 288 | 274 | 272 | 262 | 283 |
| 2024 | 268 | |||||||||||
| - = No Data Reported; -- = Not Applicable; NA = Not Available; W = Withheld to avoid disclosure of individual company data. |
| Release Date: 3/29/2024 |
| Next Release Date: 4/30/2024 |