|
Download Data (XLS File) |
|
||||||||
|
||||||||
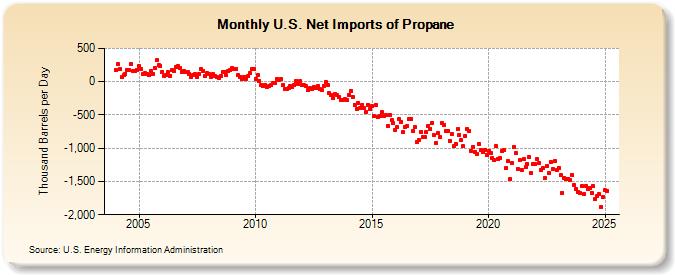
| U.S. Net Imports of Propane (Thousand Barrels per Day) | ||||||||
| Year | Jan | Feb | Mar | Apr | May | Jun | Jul | Aug | Sep | Oct | Nov | Dec |
|---|---|---|---|---|---|---|---|---|---|---|---|---|
| 2004 | 179 | 260 | 189 | 64 | 100 | 118 | 181 | 177 | 271 | 160 | 165 | 176 |
| 2005 | 229 | 192 | 115 | 126 | 121 | 94 | 163 | 117 | 212 | 320 | 254 | 233 |
| 2006 | 149 | 88 | 93 | 143 | 92 | 170 | 159 | 218 | 237 | 206 | 152 | 161 |
| 2007 | 145 | 140 | 119 | 75 | 96 | 110 | 72 | 117 | 191 | 164 | 83 | 123 |
| 2008 | 119 | 74 | 108 | 83 | 68 | 52 | 84 | 145 | 146 | 95 | 156 | 176 |
| 2009 | 204 | 189 | 197 | 101 | 70 | 47 | 77 | 39 | 82 | 133 | 187 | 190 |
| 2010 | 36 | 94 | 12 | -45 | -69 | -46 | -76 | -58 | -51 | -16 | -17 | 44 |
| 2011 | 19 | 40 | -52 | -108 | -105 | -89 | -69 | -74 | -51 | 14 | -33 | 4 |
| 2012 | -49 | -47 | -71 | -128 | -96 | -108 | -80 | -89 | -68 | -111 | -121 | -64 |
| 2013 | -5 | -44 | -171 | -196 | -249 | -183 | -206 | -233 | -271 | -274 | -266 | -279 |
| 2014 | -195 | -144 | -225 | -344 | -406 | -315 | -390 | -346 | -402 | -461 | -351 | -412 |
| 2015 | -373 | -520 | -345 | -526 | -515 | -461 | -522 | -508 | -662 | -496 | -581 | -625 |
| 2016 | -720 | -687 | -567 | -606 | -761 | -680 | -663 | -566 | -555 | -746 | -685 | -907 |
| 2017 | -882 | -753 | -833 | -827 | -757 | -661 | -708 | -619 | -806 | -919 | -774 | -826 |
| 2018 | -625 | -644 | -740 | -745 | -889 | -792 | -971 | -933 | -713 | -795 | -882 | -973 |
| 2019 | -816 | -719 | -743 | -1,042 | -978 | -1,053 | -1,082 | -931 | -1,022 | -1,053 | -1,027 | -1,101 |
| 2020 | -1,044 | -1,077 | -1,153 | -1,185 | -971 | -1,169 | -1,148 | -1,046 | -1,026 | -1,299 | -1,194 | -1,470 |
| 2021 | -1,217 | -977 | -1,076 | -1,315 | -1,184 | -1,321 | -1,170 | -1,289 | -1,237 | -1,136 | -1,376 | -1,245 |
| 2022 | -1,241 | -1,164 | -1,223 | -1,328 | -1,298 | -1,451 | -1,265 | -1,373 | -1,209 | -1,320 | -1,198 | -1,332 |
| 2023 | -1,292 | -1,379 | -1,557 | -1,386 | -1,414 | -1,430 | -1,475 | -1,388 | -1,524 | -1,602 | -1,683 | -1,719 |
| 2024 | -1,569 | |||||||||||
| - = No Data Reported; -- = Not Applicable; NA = Not Available; W = Withheld to avoid disclosure of individual company data. |
| Release Date: 3/29/2024 |
| Next Release Date: 4/30/2024 |