|
Download Data (XLS File) |
|
||||||||
|
||||||||
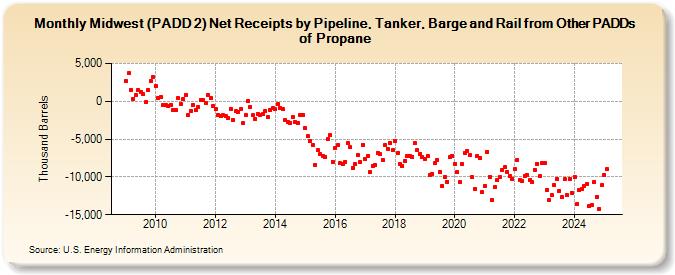
| Midwest (PADD 2) Net Receipts by Pipeline, Tanker, Barge and Rail from Other PADDs of Propane (Thousand Barrels) | ||||||||
| Year | Jan | Feb | Mar | Apr | May | Jun | Jul | Aug | Sep | Oct | Nov | Dec |
|---|---|---|---|---|---|---|---|---|---|---|---|---|
| 2009 | 2,695 | 3,695 | 1,504 | 349 | 857 | 1,432 | 1,215 | 937 | -156 | 1,485 | 2,626 | 3,198 |
| 2010 | 2,059 | 412 | 577 | -522 | -536 | -633 | -427 | -1,189 | -1,189 | 492 | -356 | 292 |
| 2011 | 897 | -1,835 | -1,228 | -435 | -1,121 | -734 | 197 | 202 | -198 | 851 | 396 | -576 |
| 2012 | -1,026 | -1,842 | -1,964 | -1,865 | -1,951 | -2,186 | -990 | -2,477 | -1,330 | -1,426 | -1,062 | -2,924 |
| 2013 | -1,869 | -1 | -715 | -1,865 | -2,320 | -1,633 | -1,793 | -1,719 | -1,299 | -2,110 | -1,086 | -900 |
| 2014 | -1,068 | -395 | -903 | -1,065 | -2,475 | -2,682 | -2,814 | -2,082 | -2,731 | -2,911 | -1,821 | -1,751 |
| 2015 | -3,576 | -4,652 | -5,232 | -5,804 | -8,410 | -6,429 | -7,004 | -7,264 | -7,347 | -5,022 | -4,495 | -7,980 |
| 2016 | -6,161 | -5,804 | -8,171 | -8,250 | -7,974 | -5,536 | -6,094 | -8,810 | -8,314 | -7,108 | -8,045 | -5,747 |
| 2017 | -7,638 | -7,226 | -9,373 | -8,587 | -8,408 | -6,814 | -7,005 | -7,722 | -5,812 | -6,270 | -5,460 | -6,472 |
| 2018 | -5,210 | -6,863 | -8,296 | -8,590 | -7,853 | -7,223 | -7,266 | -7,322 | -5,563 | -6,433 | -6,967 | -7,380 |
| 2019 | -7,568 | -7,221 | -9,749 | -9,565 | -8,178 | -7,727 | -9,300 | -11,148 | -9,998 | -10,613 | -7,433 | -7,193 |
| 2020 | -8,316 | -9,399 | -10,649 | -8,287 | -6,836 | -6,573 | -7,078 | -10,027 | -11,586 | -7,255 | -7,452 | -12,042 |
| 2021 | -11,236 | -6,656 | -9,959 | -13,010 | -11,369 | -10,460 | -10,039 | -9,027 | -8,734 | -9,292 | -9,830 | -10,232 |
| 2022 | -9,016 | -7,720 | -10,393 | -10,533 | -9,896 | -9,689 | -10,463 | -10,700 | -9,024 | -8,263 | -9,939 | -8,189 |
| 2023 | -8,120 | -11,679 | -11,169 | -11,292 | -11,131 | -10,219 | -11,767 | -12,698 | -10,348 | -12,429 | -10,272 | -10,927 |
| 2024 | -10,124 | |||||||||||
| - = No Data Reported; -- = Not Applicable; NA = Not Available; W = Withheld to avoid disclosure of individual company data. |
| Release Date: 3/29/2024 |
| Next Release Date: 4/30/2024 |