|
Download Data (XLS File) |
|
||||||||
|
||||||||
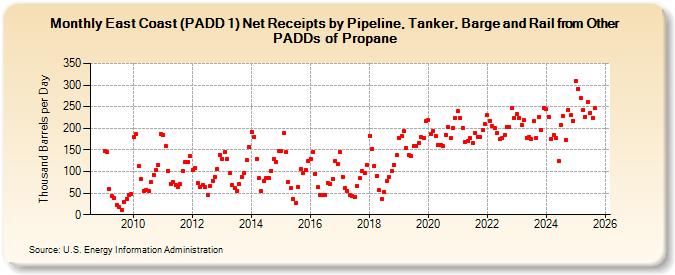
| East Coast (PADD 1) Net Receipts by Pipeline, Tanker, Barge and Rail from Other PADDs of Propane (Thousand Barrels per Day) | ||||||||
| Year | Jan | Feb | Mar | Apr | May | Jun | Jul | Aug | Sep | Oct | Nov | Dec |
|---|---|---|---|---|---|---|---|---|---|---|---|---|
| 2009 | 147 | 144 | 59 | 43 | 38 | 23 | 17 | 11 | 30 | 37 | 46 | 48 |
| 2010 | 180 | 186 | 112 | 83 | 56 | 57 | 56 | 75 | 93 | 104 | 115 | 187 |
| 2011 | 185 | 158 | 102 | 72 | 76 | 69 | 63 | 70 | 102 | 121 | 123 | 135 |
| 2012 | 104 | 108 | 73 | 63 | 68 | 63 | 46 | 67 | 79 | 88 | 105 | 139 |
| 2013 | 130 | 145 | 130 | 96 | 68 | 61 | 56 | 70 | 87 | 96 | 126 | 157 |
| 2014 | 191 | 179 | 129 | 84 | 54 | 79 | 85 | 84 | 102 | 130 | 122 | 148 |
| 2015 | 148 | 188 | 144 | 76 | 61 | 36 | 28 | 65 | 105 | 96 | 104 | 124 |
| 2016 | 130 | 144 | 95 | 63 | 46 | 46 | 46 | 74 | 72 | 83 | 125 | 117 |
| 2017 | 145 | 88 | 61 | 56 | 45 | 44 | 42 | 66 | 84 | 102 | 96 | 115 |
| 2018 | 183 | 153 | 113 | 90 | 57 | 36 | 52 | 79 | 87 | 101 | 116 | 138 |
| 2019 | 177 | 182 | 193 | 155 | 138 | 136 | 160 | 160 | 167 | 179 | 177 | 216 |
| 2020 | 219 | 186 | 194 | 183 | 162 | 162 | 158 | 185 | 202 | 178 | 201 | 224 |
| 2021 | 239 | 224 | 201 | 169 | 171 | 177 | 166 | 190 | 181 | 179 | 196 | 209 |
| 2022 | 230 | 218 | 205 | 200 | 188 | 175 | 177 | 184 | 204 | 204 | 246 | 223 |
| 2023 | 229 | 224 | 146 | 180 | 178 | 180 | 175 | 216 | 179 | 225 | 194 | 211 |
| 2024 | 247 | |||||||||||
| - = No Data Reported; -- = Not Applicable; NA = Not Available; W = Withheld to avoid disclosure of individual company data. |
| Release Date: 3/29/2024 |
| Next Release Date: 4/30/2024 |
Referring Pages: