|
Download Data (XLS File) |
|
||||||||
|
||||||||
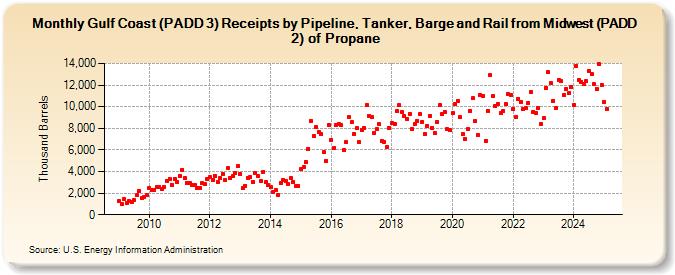
| Gulf Coast (PADD 3) Receipts by Pipeline, Tanker, Barge and Rail from Midwest (PADD 2) of Propane (Thousand Barrels) | ||||||||
| Year | Jan | Feb | Mar | Apr | May | Jun | Jul | Aug | Sep | Oct | Nov | Dec |
|---|---|---|---|---|---|---|---|---|---|---|---|---|
| 2009 | 1,261 | 1,023 | 1,436 | 1,120 | 1,247 | 1,180 | 1,355 | 1,780 | 2,175 | 1,552 | 1,643 | 1,785 |
| 2010 | 2,472 | 2,265 | 2,324 | 2,596 | 2,606 | 2,347 | 2,555 | 3,147 | 3,293 | 2,783 | 3,306 | 3,062 |
| 2011 | 3,610 | 4,165 | 3,391 | 2,898 | 2,897 | 2,710 | 2,797 | 2,506 | 2,494 | 2,910 | 2,812 | 3,308 |
| 2012 | 3,485 | 3,226 | 3,604 | 3,039 | 3,374 | 3,801 | 3,250 | 4,293 | 3,390 | 3,555 | 3,847 | 4,495 |
| 2013 | 3,761 | 2,459 | 2,684 | 3,426 | 3,460 | 3,062 | 3,822 | 3,593 | 3,114 | 4,000 | 2,998 | 2,711 |
| 2014 | 2,576 | 2,111 | 2,271 | 1,869 | 2,967 | 3,231 | 3,156 | 2,848 | 3,398 | 3,015 | 2,696 | 2,678 |
| 2015 | 4,195 | 4,416 | 4,898 | 6,118 | 8,720 | 7,291 | 8,105 | 7,623 | 7,443 | 5,780 | 4,998 | 8,262 |
| 2016 | 6,951 | 6,208 | 8,340 | 8,400 | 8,274 | 5,972 | 6,706 | 9,005 | 8,567 | 7,501 | 8,027 | 6,724 |
| 2017 | 7,872 | 8,048 | 10,137 | 9,170 | 9,079 | 7,603 | 7,954 | 8,392 | 6,843 | 6,744 | 6,254 | 8,014 |
| 2018 | 8,494 | 8,393 | 9,642 | 10,144 | 9,520 | 9,133 | 8,855 | 9,332 | 7,939 | 8,393 | 8,704 | 9,332 |
| 2019 | 8,621 | 7,457 | 8,238 | 9,180 | 8,047 | 7,548 | 8,619 | 10,150 | 9,296 | 9,516 | 7,908 | 7,810 |
| 2020 | 9,380 | 10,218 | 10,542 | 9,042 | 7,462 | 7,030 | 7,942 | 9,630 | 10,780 | 8,683 | 7,425 | 11,064 |
| 2021 | 11,035 | 6,855 | 9,631 | 12,900 | 10,980 | 10,029 | 10,266 | 9,462 | 9,597 | 10,268 | 11,163 | 11,090 |
| 2022 | 9,743 | 9,046 | 10,740 | 10,446 | 9,807 | 9,852 | 10,371 | 11,367 | 9,530 | 9,407 | 9,900 | 8,414 |
| 2023 | 8,973 | 11,773 | 13,185 | 12,157 | 10,575 | 9,866 | 12,408 | 12,380 | 11,075 | 11,660 | 11,220 | 11,858 |
| 2024 | 10,261 | |||||||||||
| - = No Data Reported; -- = Not Applicable; NA = Not Available; W = Withheld to avoid disclosure of individual company data. |
| Release Date: 3/29/2024 |
| Next Release Date: 4/30/2024 |