|
Download Data (XLS File) |
|
||||||||
|
||||||||
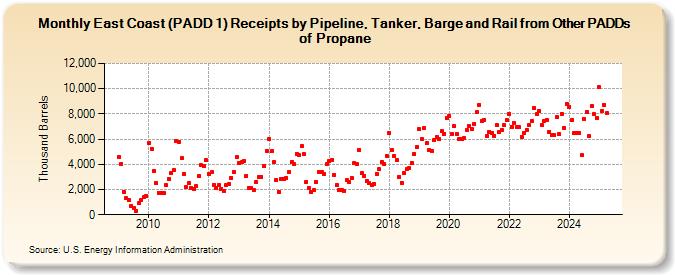
| East Coast (PADD 1) Receipts by Pipeline, Tanker, Barge and Rail from Other PADDs of Propane (Thousand Barrels) | ||||||||
| Year | Jan | Feb | Mar | Apr | May | Jun | Jul | Aug | Sep | Oct | Nov | Dec |
|---|---|---|---|---|---|---|---|---|---|---|---|---|
| 2009 | 4,554 | 4,040 | 1,836 | 1,303 | 1,184 | 699 | 540 | 334 | 903 | 1,142 | 1,380 | 1,500 |
| 2010 | 5,653 | 5,249 | 3,484 | 2,527 | 1,762 | 1,722 | 1,726 | 2,328 | 2,831 | 3,311 | 3,522 | 5,838 |
| 2011 | 5,803 | 4,472 | 3,256 | 2,178 | 2,493 | 2,117 | 2,057 | 2,248 | 3,090 | 3,907 | 3,845 | 4,320 |
| 2012 | 3,265 | 3,351 | 2,376 | 2,086 | 2,354 | 2,021 | 1,906 | 2,377 | 2,428 | 2,930 | 3,395 | 4,552 |
| 2013 | 4,099 | 4,153 | 4,281 | 3,106 | 2,127 | 2,104 | 1,925 | 2,601 | 2,963 | 3,024 | 3,850 | 5,069 |
| 2014 | 5,998 | 5,019 | 4,146 | 2,763 | 1,831 | 2,801 | 2,872 | 2,921 | 3,374 | 4,174 | 3,995 | 4,840 |
| 2015 | 4,725 | 5,450 | 4,815 | 2,615 | 2,123 | 1,773 | 1,971 | 2,586 | 3,350 | 3,355 | 3,238 | 4,002 |
| 2016 | 4,281 | 4,310 | 3,175 | 2,373 | 1,965 | 1,932 | 1,912 | 2,722 | 2,558 | 2,917 | 4,099 | 3,988 |
| 2017 | 5,156 | 3,288 | 3,104 | 2,670 | 2,481 | 2,346 | 2,457 | 3,266 | 3,596 | 4,185 | 4,042 | 4,683 |
| 2018 | 6,519 | 5,145 | 4,693 | 4,340 | 3,031 | 2,544 | 3,292 | 3,613 | 3,679 | 4,095 | 4,855 | 5,358 |
| 2019 | 6,764 | 5,974 | 6,859 | 5,657 | 5,140 | 5,082 | 5,895 | 6,180 | 6,017 | 6,616 | 6,435 | 7,691 |
| 2020 | 7,852 | 6,435 | 7,005 | 6,406 | 6,009 | 5,989 | 6,098 | 6,756 | 7,048 | 6,808 | 7,206 | 8,111 |
| 2021 | 8,722 | 7,442 | 7,525 | 6,269 | 6,597 | 6,475 | 6,283 | 7,102 | 6,570 | 6,757 | 7,089 | 7,485 |
| 2022 | 8,021 | 6,980 | 7,271 | 6,960 | 6,921 | 6,199 | 6,470 | 6,722 | 7,090 | 7,421 | 8,452 | 7,971 |
| 2023 | 8,223 | 7,101 | 5,507 | 6,409 | 6,590 | 6,329 | 6,329 | 7,746 | 6,406 | 8,011 | 6,885 | 7,643 |
| 2024 | 8,722 | |||||||||||
| - = No Data Reported; -- = Not Applicable; NA = Not Available; W = Withheld to avoid disclosure of individual company data. |
| Release Date: 3/29/2024 |
| Next Release Date: 4/30/2024 |