|
Download Data (XLS File) |
|
||||||||
|
||||||||
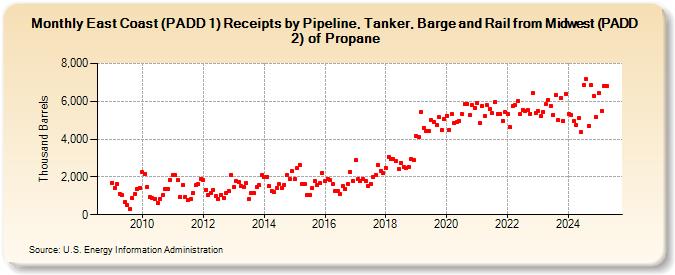
| East Coast (PADD 1) Receipts by Pipeline, Tanker, Barge and Rail from Midwest (PADD 2) of Propane (Thousand Barrels) | ||||||||
| Year | Jan | Feb | Mar | Apr | May | Jun | Jul | Aug | Sep | Oct | Nov | Dec |
|---|---|---|---|---|---|---|---|---|---|---|---|---|
| 2009 | 1,702 | 1,437 | 1,631 | 1,096 | 1,022 | 655 | 490 | 284 | 859 | 1,096 | 1,335 | 1,436 |
| 2010 | 2,243 | 2,178 | 1,477 | 913 | 865 | 832 | 611 | 846 | 1,036 | 1,366 | 1,350 | 1,835 |
| 2011 | 2,127 | 2,094 | 1,843 | 959 | 1,595 | 942 | 786 | 811 | 1,160 | 1,556 | 1,606 | 1,903 |
| 2012 | 1,853 | 1,328 | 1,065 | 1,157 | 1,323 | 974 | 856 | 1,044 | 895 | 1,138 | 1,254 | 2,118 |
| 2013 | 1,483 | 1,778 | 1,740 | 1,508 | 1,488 | 1,677 | 821 | 1,129 | 1,125 | 1,453 | 1,563 | 2,089 |
| 2014 | 1,993 | 2,001 | 1,530 | 1,266 | 1,206 | 1,420 | 1,608 | 1,410 | 1,585 | 2,093 | 1,866 | 2,295 |
| 2015 | 1,875 | 2,492 | 2,653 | 1,651 | 1,607 | 1,046 | 1,066 | 1,435 | 1,780 | 1,582 | 1,688 | 2,214 |
| 2016 | 1,772 | 1,896 | 1,810 | 1,624 | 1,250 | 1,234 | 1,122 | 1,531 | 1,354 | 1,618 | 2,281 | 1,766 |
| 2017 | 2,879 | 1,884 | 1,768 | 1,865 | 1,781 | 1,540 | 1,605 | 1,994 | 2,114 | 2,627 | 2,326 | 2,184 |
| 2018 | 2,494 | 3,066 | 2,935 | 2,929 | 2,828 | 2,393 | 2,739 | 2,545 | 2,495 | 2,538 | 2,946 | 2,897 |
| 2019 | 4,153 | 4,099 | 5,449 | 4,613 | 4,403 | 4,423 | 5,004 | 4,927 | 4,761 | 5,149 | 4,474 | 5,089 |
| 2020 | 5,237 | 4,495 | 5,323 | 4,837 | 4,891 | 4,961 | 5,328 | 5,849 | 5,878 | 5,277 | 5,799 | 5,664 |
| 2021 | 5,899 | 4,827 | 5,760 | 5,226 | 5,781 | 5,605 | 5,358 | 5,970 | 5,335 | 5,350 | 4,969 | 5,416 |
| 2022 | 5,341 | 4,619 | 5,755 | 5,791 | 6,009 | 5,336 | 5,542 | 5,479 | 5,520 | 5,349 | 6,438 | 5,371 |
| 2023 | 5,493 | 5,205 | 3,541 | 4,700 | 6,094 | 5,769 | 5,284 | 6,339 | 5,018 | 6,188 | 4,979 | 5,283 |
| 2024 | 5,434 | |||||||||||
| - = No Data Reported; -- = Not Applicable; NA = Not Available; W = Withheld to avoid disclosure of individual company data. |
| Release Date: 3/29/2024 |
| Next Release Date: 4/30/2024 |