|
Download Data (XLS File) |
|
||||||||
|
||||||||
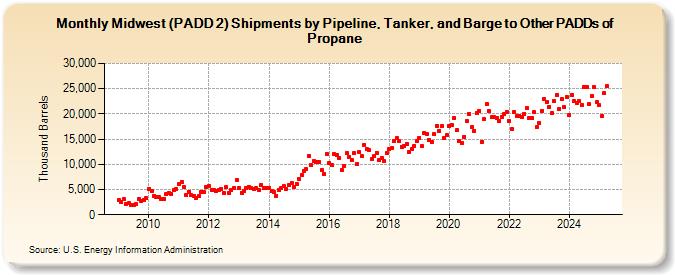
| Midwest (PADD 2) Shipments by Pipeline, Tanker, and Barge to Other PADDs of Propane (Thousand Barrels) | ||||||||
| Year | Jan | Feb | Mar | Apr | May | Jun | Jul | Aug | Sep | Oct | Nov | Dec |
|---|---|---|---|---|---|---|---|---|---|---|---|---|
| 2009 | 2,963 | 2,460 | 3,067 | 2,216 | 2,269 | 1,835 | 1,845 | 2,064 | 3,034 | 2,648 | 2,978 | 3,221 |
| 2010 | 5,091 | 4,698 | 3,801 | 3,541 | 3,486 | 3,188 | 3,172 | 4,049 | 4,329 | 4,185 | 4,840 | 5,138 |
| 2011 | 6,023 | 6,442 | 5,498 | 3,918 | 4,569 | 3,814 | 3,658 | 3,411 | 3,753 | 4,598 | 4,563 | 5,461 |
| 2012 | 5,693 | 4,859 | 4,919 | 4,619 | 4,972 | 5,045 | 4,279 | 5,425 | 4,402 | 4,885 | 5,204 | 6,880 |
| 2013 | 5,366 | 4,400 | 4,669 | 5,278 | 5,558 | 5,228 | 5,049 | 5,257 | 4,852 | 5,920 | 5,242 | 5,362 |
| 2014 | 5,335 | 4,632 | 4,414 | 3,741 | 4,870 | 5,256 | 5,624 | 5,118 | 5,899 | 6,257 | 5,505 | 6,102 |
| 2015 | 7,064 | 7,873 | 8,693 | 8,971 | 11,662 | 9,800 | 10,638 | 10,502 | 10,510 | 8,869 | 8,097 | 12,032 |
| 2016 | 10,220 | 9,823 | 12,047 | 11,764 | 11,334 | 8,950 | 9,656 | 12,187 | 11,517 | 10,882 | 12,196 | 9,965 |
| 2017 | 12,376 | 11,571 | 13,911 | 12,957 | 12,819 | 11,023 | 11,554 | 12,304 | 10,835 | 11,297 | 10,561 | 12,211 |
| 2018 | 12,958 | 13,250 | 14,646 | 15,134 | 14,544 | 13,518 | 13,678 | 13,947 | 12,504 | 12,990 | 13,715 | 14,637 |
| 2019 | 15,242 | 13,555 | 16,210 | 16,021 | 14,798 | 14,327 | 15,956 | 17,651 | 16,612 | 17,528 | 15,186 | 15,799 |
| 2020 | 17,504 | 17,747 | 19,199 | 16,730 | 14,703 | 14,318 | 15,440 | 18,594 | 20,073 | 17,322 | 16,658 | 20,223 |
| 2021 | 20,665 | 14,512 | 18,984 | 21,872 | 20,498 | 19,313 | 19,322 | 19,181 | 18,626 | 19,449 | 19,901 | 20,347 |
| 2022 | 18,611 | 17,034 | 20,413 | 19,511 | 19,649 | 19,309 | 20,061 | 21,135 | 19,131 | 19,128 | 20,301 | 17,358 |
| 2023 | 18,232 | 20,653 | 21,018 | 21,198 | 21,457 | 20,129 | 22,486 | 23,716 | 21,028 | 22,859 | 21,283 | 22,307 |
| 2024 | 20,012 | |||||||||||
| - = No Data Reported; -- = Not Applicable; NA = Not Available; W = Withheld to avoid disclosure of individual company data. |
| Release Date: 3/29/2024 |
| Next Release Date: 4/30/2024 |